
What Metrics Define a Healthy Sales Pipeline in 2026?
Most pipeline reviews ask the wrong question. "How much pipeline do we have?" sounds reasonable until you realize that a bloated pipeline full of stalled, non-ICP deals is worse than a lean one built on qualified opportunities. The real question is: what does a healthy pipeline actually look like? The answer lives in a handful of diagnostic metrics that separate real revenue from wishful thinking. Use Apollo's Sales Pipeline Builder to track these signals in one place.
Let Apollo Find Your Leads Instantly
Tired of your reps burning hours on manual lead research instead of closing deals? Apollo delivers verified contacts so your team spends time selling, not searching. Join 600K+ companies building pipeline faster.
Start Free with Apollo →Key Takeaways
- Pipeline health is determined by quality and ICP-fit, not raw volume — a small, well-qualified pipeline outperforms a large, mismatched one.
- Coverage ratios must be calibrated to your actual win rate, not a generic benchmark.
- Deal aging is a leading risk indicator: delays compound quickly and erode close probability.
- Buying-group consensus and stakeholder coverage are as important as seller activity in complex B2B deals.
- CRM data trust directly affects forecast accuracy — bad data produces bad pipeline reads.
Why Is Pipeline Volume a Misleading Health Metric?
Pipeline volume misleads because it counts all opportunities equally, regardless of fit, stage, or buyer engagement. A large pipeline number creates false confidence while disguising the real problem: most of those deals will not close.
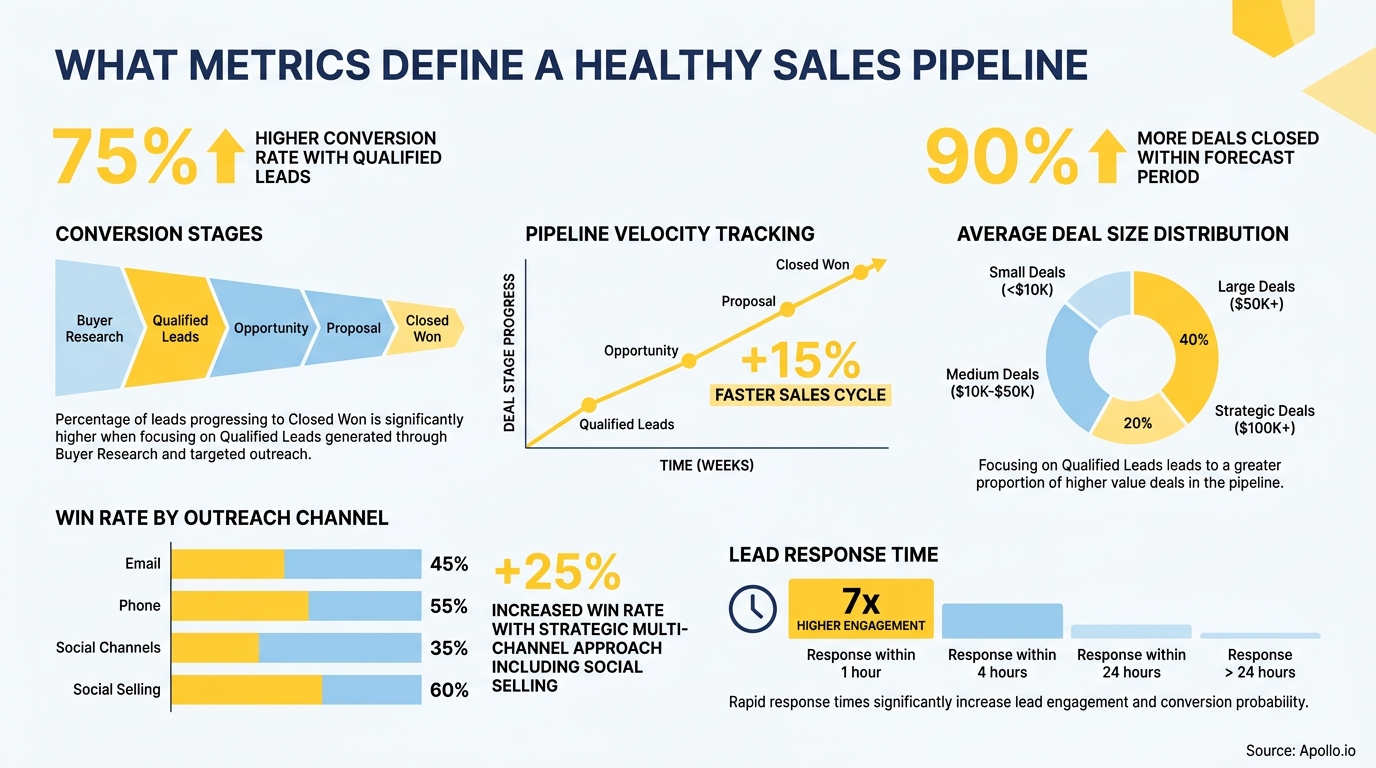
Ebsta and Pavilion's 2024 benchmark study — spanning 4.2 million opportunities and $54 billion in revenue — found that win rates increase 3.1x when opportunities match the seller's ICP, yet only 18% of pipeline in 2024 matched ICP. That gap is where most forecast misses originate. For B2B sales teams under quota pressure, filling the top of funnel with ICP-fit prospects from the start is the highest-leverage pipeline health action available.
Struggling to fill your pipeline with the right accounts? Search Apollo's 230M+ contacts using 65+ ICP filters to build qualified pipeline from day one.
What Are the Core Metrics That Define a Healthy Sales Pipeline?
A healthy pipeline scorecard covers five diagnostic dimensions: coverage, stage conversion, deal velocity, deal aging, and buyer readiness. Each metric flags a different failure mode.
| Metric | What It Measures | Warning Signal |
|---|---|---|
| Pipeline Coverage Ratio | Total pipeline value vs. quota | Below your win-rate-adjusted target (e.g., 4-5x at a 21% win rate) |
| ICP-Fit Score | % of opportunities matching ideal customer profile | Below 50% ICP-match in active pipeline |
| Stage Conversion Rate | % of deals advancing stage-to-stage | Below 20-30% opportunity-to-close rate in B2B SaaS |
| Sales Cycle Length | Average days from open to close | Deals exceeding historical stage benchmarks by 8+ weeks |
| Deal Slippage Rate | % of deals that miss their forecast close date | Above 30-40% slippage in a given quarter |
| Buying-Group Coverage | Number of stakeholders engaged per deal | Single-threaded deals (only one contact engaged) |
| Forecast Accuracy | Variance between forecast and actual revenue | Accuracy below 70-79% median (Gartner benchmark) |
According to Inaccord, healthy opportunity conversion rates in B2B SaaS range from 20-30%. Teams falling below this threshold should audit stage-entry criteria before adding more volume. For a broader view of which numbers to track alongside these, see what sales KPIs to track in 2026.

How Should RevOps Teams Calculate Pipeline Coverage Correctly?
Pipeline coverage is correctly calculated by dividing your win rate into 100% and multiplying the result by your quota — not by defaulting to a universal 3x rule. A team with a 21% win rate needs roughly 4.8x pipeline coverage just to break even before accounting for slippage and deal-quality adjustments.
The Norwest 2025 B2B Sales and Marketing Benchmark Report confirms that while most companies still target 3x coverage, the real standard is 3x coverage weighted by win rate, ACV, sales cycle length, stage aging, and deal risk. RevOps leaders who present unweighted coverage numbers to leadership are, in effect, overstating pipeline health.
Data from Gradient Works shows the average B2B sales cycle has expanded to 6.5 months, up from 4.9 months in 2019. Longer cycles mean more slippage risk, which means raw coverage ratios need a higher buffer than they did five years ago. Pair coverage math with sales analytics to surface which deals are actually moving.
Turn Forecast Guesswork Into Pipeline Clarity
Pipeline forecasting a guessing game because your deal data is always a step behind? Apollo surfaces real-time buyer signals so your team acts on facts, not hunches. Join 600K+ companies closing with confidence.
Schedule a Demo →What Is Deal Aging and Why Does It Destroy Pipeline Health?
Deal aging measures how long an opportunity has sat in a given pipeline stage relative to your historical average for that stage. Deals that exceed their stage benchmark deteriorate faster than most teams realize.
Ebsta and Pavilion's 2024 data found that win rates were 203% higher when opportunities closed within the historical "golden period" for each stage. Deals delayed more than 8 weeks saw velocity drop 67%.
That is not a gradual decline — it is a cliff. For AEs managing large books of business, this means a deal that looks alive in the CRM may already be functionally dead.
Stage-age thresholds to monitor:
- Discovery to Demo: Flag deals sitting more than 2x your team average at this stage.
- Proposal to Negotiation: No documented next step after 14 days is a red flag.
- Negotiation to Close: Any deal stalled here beyond your historical benchmark needs executive attention or a disqualification decision.
Research from Landbase shows B2B sales cycles typically range from 70 to 162 days across industries. Building stage-age alerts against your own baseline — not an industry average — is what makes deal aging actionable rather than academic. Apollo's deal management tools surface aging risks automatically so AEs and RevOps teams can act before deals slip.
How Does Buying-Group Coverage Affect Pipeline Health?
Buying-group coverage measures how many decision-makers and influencers your team has engaged within a target account. Single-threaded deals — where only one contact is active — are among the highest-risk deals in any pipeline.
Forrester's 2024 State of Business Buying found that an average of 13 people are involved in a B2B purchase decision and 89% of purchases involve two or more departments. Yet 86% of B2B purchases stall.
The correlation is clear: sellers who engage only one contact are exposed the moment that champion leaves, goes silent, or loses internal support. Tracking multi-threaded engagement as a pipeline health metric is no longer optional for complex deals.
McKinsey's 2026 B2B Pulse reinforces this shift, finding that B2B buyers now use an average of 10 touchpoints across the buying journey. Pipeline health in 2026 means measuring account engagement depth and omnichannel consistency, not just activity counts. See how customer engagement metrics connect to revenue outcomes.
Why Does CRM Data Quality Undermine Pipeline Metrics?
CRM data quality undermines pipeline metrics because inaccurate records produce inaccurate forecasts — and most sales organizations already have a data trust problem. Salesforce's 2026 State of Sales found that sales reps spend 60% of their time on non-selling tasks, much of it on manual data entry and CRM hygiene that should be automated.
When deal stages, close dates, and contact records are stale or wrong, every metric on your pipeline scorecard becomes unreliable. Gartner reports that only 7% of sales teams achieve forecast accuracy above 90%, with median accuracy sitting at 70-79%.
Clean data is not a RevOps vanity project — it is the foundation that makes every other pipeline metric trustworthy.
Want cleaner pipeline data without manual work? Apollo's deal management platform keeps pipeline records current so your forecasts reflect reality, not wishful thinking. For a broader view of the performance drivers behind these numbers, see what factors affect sales performance.
How Can SDRs and AEs Use These Metrics to Hit Quota Faster?
SDRs and AEs can use pipeline health metrics as a personal scorecard, not just a management reporting tool. The metrics that matter most at the rep level are ICP-fit rate, stage conversion, and deal age — because these are the inputs reps directly control.
For SDRs: track what percentage of your booked meetings come from ICP-fit accounts. If that number is low, your meetings are not converting downstream regardless of activity volume.
For AEs: monitor your own deal age by stage. If you have deals sitting in "Proposal Sent" for three weeks with no documented next step, that deal is at risk — and a proactive disqualification now protects your forecast later.
Gartner's 2026 analysis notes that CSOs relying only on lagging indicators like win rate and deal size miss the real drivers of seller performance. Account reach, account engagement, and average interaction value are the leading indicators that predict whether lagging metrics will improve next quarter. Pair these signals with a clear B2B SaaS sales funnel framework to understand where your deals are progressing and where they stall.

Build a Pipeline That Actually Converts in 2026
A healthy sales pipeline is defined by ICP-fit quality, win-rate-adjusted coverage, stage conversion rates, deal aging thresholds, buying-group engagement, and CRM data integrity — not by raw volume. Each metric is a diagnostic signal.
Together, they give revenue leaders, RevOps teams, AEs, and SDRs a complete picture of what is real and what is at risk.
The teams winning in 2026 are moving beyond dashboard reviews toward proactive pipeline management: flagging aging deals early, disqualifying fast, and filling the top of funnel with ICP-fit accounts from the start. Apollo consolidates prospecting, engagement, and pipeline tracking into one platform — so your team spends less time managing tools and more time closing. "Having everything in one system was a game changer," said the team at Cyera.
Get Leads Now and start building a pipeline worth measuring.
Prove Pipeline ROI With Apollo
Budget approval stuck on unclear pipeline metrics? Apollo surfaces real customer outcomes — teams like Leadium 3x'd revenue and Built-In gained +10% win rates. Start your free trial and show leadership ROI fast.
Start Free with Apollo →Don't miss these
Sales
Inbound vs Outbound Marketing: Which Strategy Wins?
Sales
What Is a Sales Funnel? The Non-Linear Revenue Framework for 2026
Sales
What Is a Go-to-Market Strategy? The 2026 GTM Playbook
See Apollo in action
We'd love to show how Apollo can help you sell better.
By submitting this form, you will receive information, tips, and promotions from Apollo. To learn more, see our Privacy Statement.
4.7/5 based on 9,015 reviews
