
What Are Sales KPIs and Why Do They Matter in 2026?
Sales KPIs (Key Performance Indicators) are measurable metrics that track your team's progress toward revenue goals. They reveal what's working, what's broken, and where to invest resources for maximum ROI.
In 2026, with AI reshaping B2B sales and e-commerce channels now driving 34% of B2B revenue, tracking the right KPIs separates high-performing teams from those guessing their way through quota.
This guide breaks down the essential sales KPIs every team should track, industry benchmarks that matter, and how AI-powered platforms help you move from data chaos to actionable insights.
Apollo Cuts Research Time From Hours To Seconds
Tired of spending 4+ hours daily hunting for contact info? Apollo delivers 224M verified contacts with 96% email accuracy instantly. Join 550K+ companies who replaced manual research with predictable pipeline.
Start Free with Apollo →Key Takeaways
- Track 8-12 core KPIs across pipeline, activity, conversion, and revenue stages to maintain focus without data overwhelm
- According to McKinsey's 2024 B2B Pulse, e-commerce now accounts for 34% of B2B revenue, requiring new KPI frameworks for digital channels
- AI adoption drives measurable KPI improvements: 46% more meetings booked and 35% increase in conversion rates when using AI research and messaging tools
- Channel-specific KPIs (outbound, inbound, e-commerce) require different benchmarks and measurement approaches
- Modern sales platforms consolidate KPI tracking into one workspace, eliminating the need for multiple dashboards and tools
What Makes a Sales KPI Effective?
Not all metrics deserve dashboard space. Effective sales KPIs share three characteristics: they're actionable (you can influence the outcome), leading indicators (they predict future results), and aligned with revenue (they connect directly to closed deals).
Vanity metrics like total emails sent or LinkedIn profile views feel productive but don't predict revenue. Focus on KPIs that answer: "If this number improves, do we close more deals?"
| KPI Type | Purpose | Example Metrics |
|---|---|---|
| Activity KPIs | Measure sales effort and consistency | Calls made, emails sent, meetings booked |
| Pipeline KPIs | Track deal flow and qualification | Pipeline value, velocity, stage conversion |
| Conversion KPIs | Measure effectiveness at each stage | Lead-to-opp rate, opp-to-close rate, win rate |
| Revenue KPIs | Track financial outcomes | Quota attainment, deal size, CAC payback |
Essential Sales KPIs Every Team Should Track
Pipeline Generation KPIs
SQL (Sales Qualified Lead) Creation Rate: Number of qualified leads entering your pipeline weekly or monthly. Track by source (outbound, inbound, partner) to identify your most profitable channels.
Pipeline Coverage Ratio: Pipeline value divided by quota. Best-in-class teams maintain 3-4x coverage, meaning $3-4 million in pipeline for every $1 million in quota. Lower coverage signals lead generation problems.
Struggling to build pipeline fast enough? Search Apollo's 224M+ verified contacts with 65+ filters to find your ideal buyers in minutes.
Activity and Productivity KPIs
Connect Rate: Percentage of outreach attempts that result in a conversation. According to Apollo customer data, top-performing SDRs maintain 36%+ connect rates using verified mobile numbers and AI-powered research.
"My favorite part about Apollo is when someone asks me, 'What's your connection rate?' and I can consistently say, over the last seven months, it's at 36%."
Meetings Booked per Rep: Number of qualified meetings each rep schedules weekly. Benchmark: 8-12 meetings per SDR per week for mid-market targets, 4-6 for enterprise accounts.
Response Rate: Percentage of prospects who reply to outreach (positive or negative). Healthy response rates sit between 15-25% for cold outbound, 30-40% for warm sequences.
Conversion and Velocity KPIs
Stage Conversion Rates: Percentage of deals advancing from one stage to the next. Track each stage separately to identify bottlenecks. Typical B2B benchmarks: Discovery to Demo (60-70%), Demo to Proposal (40-50%), Proposal to Close (30-40%).
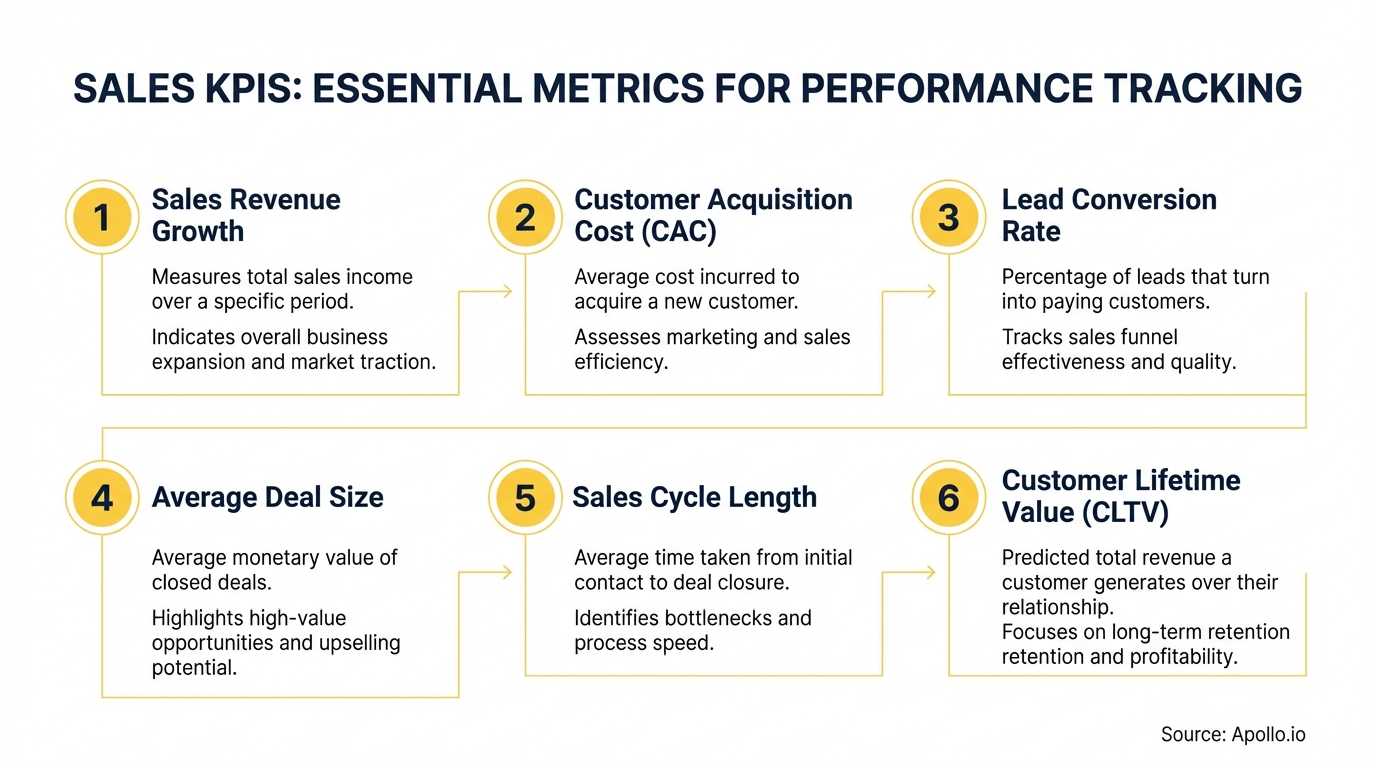
Sales Cycle Length: Average days from first contact to closed-won. Shorter cycles mean faster revenue recognition and better cash flow. Track by deal size and segment.
Win Rate: Percentage of opportunities that close as won. Overall win rates vary by industry (15-25% for new business, 60-80% for renewals), but consistent tracking reveals trends.
Revenue Performance KPIs
Quota Attainment: Percentage of reps hitting quota monthly or quarterly. Healthy sales orgs see 60-70% of reps at 80%+ quota attainment.
Average Deal Size (ADS): Mean contract value of closed deals. Growing ADS indicates better qualification or upselling. Track alongside win rate to ensure you're not sacrificing volume.
Customer Acquisition Cost (CAC): Total sales and marketing spend divided by new customers acquired. Compare against customer lifetime value (LTV). Aim for LTV:CAC ratios of 3:1 or higher.
How Do Sales KPIs Differ by Channel in 2026?
Research by McKinsey shows 71% of B2B companies now offer e-commerce, with digital channels accounting for 34% of revenue. This shift demands channel-specific KPI frameworks.

Outbound Sales KPIs
Focus on activity volume, connect rates, and top-of-funnel efficiency. Key metrics: dials per day (80-100 for high-volume SDRs), email open rates (40-60% for targeted sequences), and LinkedIn InMail acceptance rates (25-35%).
Inbound Sales KPIs
Emphasize speed-to-lead and qualification accuracy. Track: response time to inbound leads (under 5 minutes), MQL-to-SQL conversion (30-40%), and content attribution (which assets drive pipeline).
E-Commerce and Self-Serve KPIs
Monitor digital funnel metrics: website-to-trial conversion (2-5%), trial-to-paid conversion (15-25%), product-qualified lead (PQL) identification, and expansion revenue from existing accounts.
Need to track KPIs across multiple channels without switching between tools? Apollo's unified deal management platform brings all your sales data into one workspace.
What Are Realistic Sales KPI Benchmarks?
Benchmarks vary by industry, deal size, and sales motion, but these ranges represent healthy B2B performance in 2026:
| KPI | SMB/Mid-Market | Enterprise |
|---|---|---|
| Connect Rate | 25-35% | 15-25% |
| Email Response Rate | 15-25% | 10-18% |
| Meetings Booked/Week | 8-12 per SDR | 4-6 per SDR |
| Discovery-to-Demo | 60-70% | 50-65% |
| Demo-to-Proposal | 40-50% | 35-45% |
| Proposal-to-Close | 30-40% | 25-35% |
| Overall Win Rate | 20-30% | 15-25% |
| Sales Cycle Length | 30-60 days | 90-180 days |
| Quota Attainment | 60-70% of reps | 50-65% of reps |
Use these as starting points, not rigid targets. Your ideal benchmarks depend on product complexity, market maturity, and competitive dynamics. For more insights on optimizing B2B sales strategies, explore proven frameworks from high-growth teams.
Turn Forecast Guesswork Into Revenue Certainty
Forecasting unreliable because deal data isn't current. Apollo delivers real-time pipeline visibility with buying signals that predict close rates. Built-In increased win rates 10% with Apollo's intent scoring.
Start Free with Apollo →How Does AI Improve Sales KPI Performance?
AI transforms KPIs from lagging indicators into predictive tools. According to Gartner, 92% of businesses invested in AI-powered sales software in 2024, with measurable results across key metrics.
Apollo's AI capabilities demonstrate this impact: teams using AI Research Agents book 46% more meetings, while those leveraging AI messaging see 35% higher conversion rates. AI doesn't just track KPIs—it actively improves them.
"With this kind of AI system, my BDRs can send 10x more personalized emails. Their productivity and growth has skyrocketed."
AI-Powered KPI Improvements:
- Smarter Targeting: AI identifies ideal prospects based on behavioral signals, improving connect rates and qualification accuracy
- Personalization at Scale: Generate contextual messaging for every prospect, boosting response rates 2-3x
- Predictive Insights: Forecast which deals will close and which need intervention before they stall
- Automated Workflows: Trigger actions based on KPI thresholds (e.g., alert manager when rep falls below 70% quota)
Learn how AI sales tools are reshaping pipeline generation and which capabilities deliver the highest ROI.
How Should You Build a Sales KPI Dashboard?
Effective dashboards balance simplicity with depth. Start with 8-12 core KPIs visible at a glance, with drill-down capability for investigation.
Dashboard Design Principles:
- Role-Based Views: SDRs need activity and conversion metrics; AEs need pipeline and velocity; leaders need quota attainment and forecast accuracy
- Real-Time Updates: Daily refreshes for activity metrics, weekly for pipeline, monthly for revenue trends
- Comparison Context: Show current vs. target, current vs. previous period, and rep vs. team average
- Alert Thresholds: Notify when KPIs fall below acceptable ranges (e.g., connect rate drops under 20%)
Modern platforms like Apollo's analytics suite eliminate the need to build custom dashboards. Everything from prospecting to closed deals lives in one workspace, with KPIs automatically calculated and visualized.
What Are the Biggest Sales KPI Tracking Mistakes?
Tracking Too Many Metrics: More dashboards don't mean better decisions. Focus on 8-12 KPIs that directly influence revenue. The rest is noise.
Ignoring Leading Indicators: Revenue and quota attainment are lagging indicators. By the time they're broken, it's too late to fix the quarter. Track activity and pipeline metrics to predict problems early.
Using Inconsistent Definitions: Is a "qualified lead" someone who downloaded content or someone who matches ICP and has buying intent? Inconsistent definitions make KPIs worthless. Document and enforce standard definitions across teams.

Failing to Segment Data: Blended averages hide performance gaps. Segment KPIs by rep, segment, channel, and product line to identify specific improvement opportunities.
Not Connecting KPIs to Actions: Dashboards that don't drive behavior change waste time. Every KPI review should end with: "What are we doing differently based on this data?"
How Do Top-Performing Teams Use Sales KPIs?
Elite sales organizations don't just track KPIs—they use them to run experiments, coach reps, and allocate resources. Here's how:
Weekly KPI Reviews: Managers review individual rep performance against targets, identifying coaching opportunities before small gaps become big misses. Focus on 2-3 improvement areas per rep, not a laundry list.
A/B Testing Based on KPIs: Test new messaging, sequences, or targeting criteria on a subset of the team. Measure impact on connect rates, response rates, and conversion before rolling out widely. Learn from teams using creative approaches like humor in sales outreach to stand out.
Forecasting and Resource Planning: Use pipeline coverage and velocity metrics to predict future revenue and identify hiring needs. If your team needs 4x coverage and current reps generate $2M pipeline each, you know exactly how many reps to hire.
Compensation Tied to KPIs: Beyond quota attainment, tie bonuses or SPIFs to leading indicators (meetings booked, pipeline generated) to reward behaviors that drive future revenue.
For implementation guidance, explore strategic frameworks for sales development that connect KPIs to team structure and growth.
Conclusion: Turn Sales KPIs Into Your Competitive Advantage
Sales KPIs aren't about tracking everything—they're about tracking what matters. Focus on metrics that predict revenue, measure them consistently, and use the data to make faster, smarter decisions than your competition.
In 2026, the best teams consolidate their sales tech stack into unified platforms that automatically track KPIs across prospecting, engagement, and deal execution. No more switching between tools or wrestling with spreadsheets.
Ready to transform your KPI tracking? Start prospecting with Apollo's all-in-one platform—free to get started.
Prove Apollo's Value In Your First Week
Budget approval stuck on unclear metrics? Apollo tracks every touchpoint from first contact to closed deal. Built-In increased win rates 10% and ACV 10% with Apollo's pipeline visibility.
Start Free with Apollo →Don't miss these
Sales
Inbound vs Outbound Marketing: Which Strategy Wins?
Sales
What Is a Sales Funnel? The Non-Linear Revenue Framework for 2026
Sales
What Is a Go-to-Market Strategy? The 2026 GTM Playbook
See Apollo in action
We'd love to show how Apollo can help you sell better.
By submitting this form, you will receive information, tips, and promotions from Apollo. To learn more, see our Privacy Statement.
4.7/5 based on 9,015 reviews
