
How Sales Analytics Drive Revenue Growth in 2026
Sales analytics transforms raw data into revenue. By 2026, Gartner predicts 65% of B2B sales organizations will shift from gut-feel decisions to data-driven strategies. The winners won't just have analytics—they'll balance AI efficiency with human connection across hybrid sales channels.
This guide shows you how to build a sales analytics framework that drives measurable growth, not just dashboards.
Apollo Turns Research Hours Into Selling Time
Tired of spending 4+ hours daily hunting for contact info? Apollo delivers 224M verified contacts with 96% email accuracy instantly. Join 550K+ companies who replaced manual research with predictable pipeline.
Start Free with Apollo →Key Takeaways
- Sales analytics is the practice of collecting, analyzing, and applying sales data to optimize performance and forecast revenue accurately
- By 2026, 65% of B2B sales teams will use data-driven decision-making integrated with AI and human touchpoints
- Hybrid sales models combining in-person, remote, and digital self-serve channels require unified analytics across all touchpoints
- The most critical metrics include pipeline velocity, conversion rates by stage, win rate by segment, and customer acquisition cost
- Successful implementation balances technology adoption with change management and requires executive sponsorship
What Is Sales Analytics?
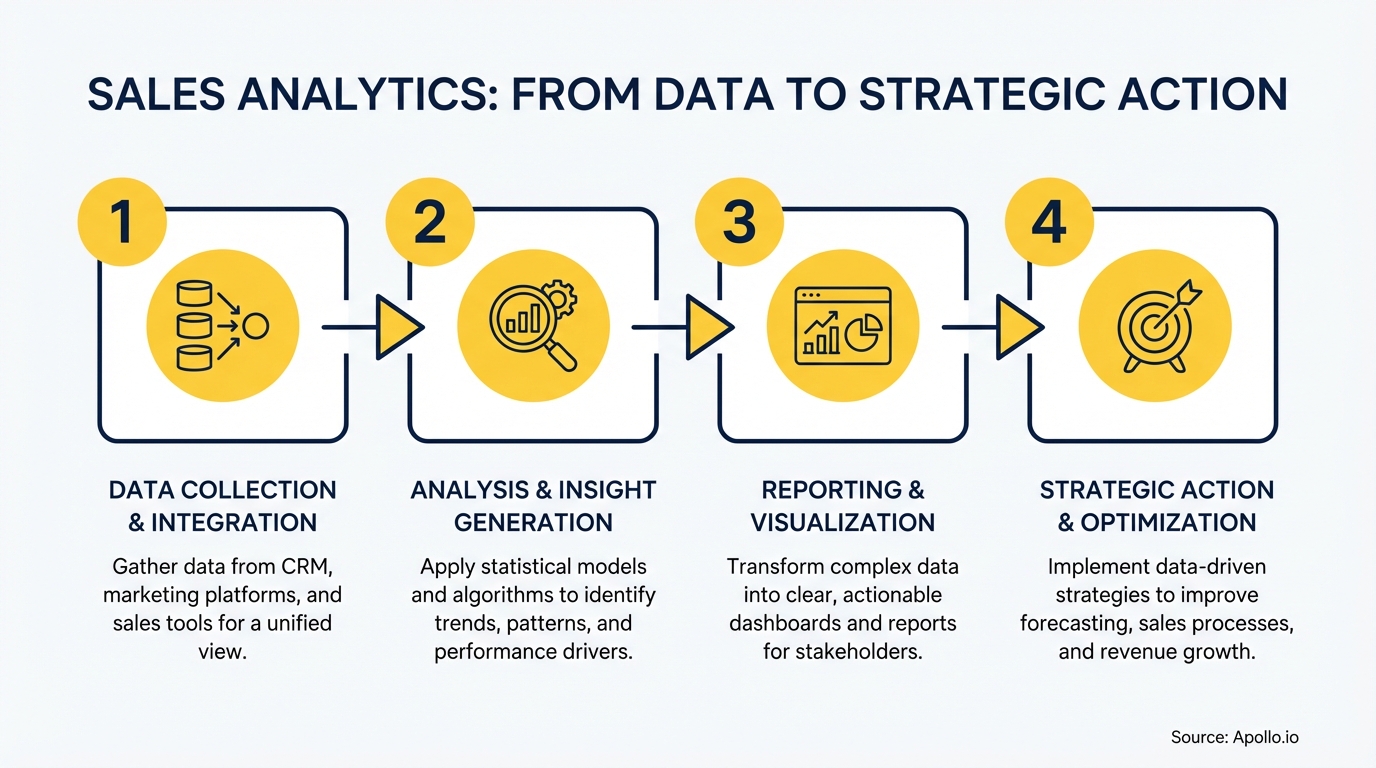
Sales analytics is the systematic collection and analysis of sales data to identify patterns, predict outcomes, and guide decisions. It transforms CRM records, email engagement, call logs, and deal history into actionable intelligence.
Sales analytics IS a continuous process of measuring, analyzing, and optimizing sales activities. It IS NOT just reporting historical numbers or generating dashboards without action.
Modern sales analytics covers three dimensions:
- Descriptive analytics: What happened? (revenue by rep, pipeline by stage, activity volume)
- Predictive analytics: What will happen? (forecast accuracy, churn risk, deal scoring)
- Prescriptive analytics: What should we do? (next-best actions, resource allocation, pricing optimization)
"Apollo gets us the people we need to speak to. Without that, there's no business. I love the fact that everything is in there together. It's all streamlined and connected."
Why Sales Analytics Matters in 2026
The B2B buying landscape has fundamentally shifted. According to McKinsey research, hybrid selling combining in-person, remote, and digital self-serve is now the dominant sales model. Buyers expect seamless experiences across channels.
This creates three critical challenges for sales leaders:
- Channel fragmentation: Buyers engage across 10+ touchpoints before purchasing. Without unified analytics, you can't see the full journey.
- Data silos: Sales data lives in CRM, engagement data in sequences, conversation intelligence in call tools, and enrichment data elsewhere. Disconnected systems kill visibility.
- AI without context: By 2030, 75% of B2B buyers will prefer human interaction over AI. Analytics must optimize for human connection, not replace it.
Organizations with mature sales analytics report 15-20% higher win rates and 25% faster sales cycles compared to those relying on intuition alone.
Essential Sales Analytics Metrics That Drive Results
Focus on metrics that predict revenue, not vanity numbers. Track these across your sales pipeline and buyer journey:
| Metric Category | Key Metrics | Why It Matters |
|---|---|---|
| Pipeline Health | Pipeline velocity, stage conversion rates, deal aging | Predicts revenue 60-90 days out and identifies bottlenecks |
| Activity Effectiveness | Emails/calls per opp, response rates, meeting-to-opp rate | Shows which activities actually move deals forward |
| Revenue Performance | Win rate by segment, average deal size, sales cycle length | Reveals where to focus resources for maximum ROI |
| Forecast Accuracy | Forecast vs. actuals, commit rate, slippage rate | Enables better resource planning and board confidence |
| Rep Productivity | Quota attainment, ramp time, activities per day | Identifies coaching opportunities and hiring needs |
Need clean data to power these metrics? Apollo enriches your CRM with 224M+ verified contacts so your analytics reflect reality, not incomplete records.
"Apollo enriches everything we have: contacts, leads, accounts... And we don't really have to touch it, it just works."

Building a Hybrid Sales Analytics Framework
A hybrid sales model requires analytics that track buyer behavior across in-person meetings, remote calls, email sequences, and digital self-serve channels. Here's how to build it:
Step 1: Map Your Buyer Journey Across Channels
Document every touchpoint from first contact to closed-won. Include marketing touches, sales activities, product interactions, and self-serve research.
Most organizations have 15-25 distinct touchpoints.
Step 2: Unify Data Sources
Break down silos between your CRM, sales engagement platform, conversation intelligence, marketing automation, and product analytics. Use a unified platform or robust integrations to create a single source of truth.
Step 3: Define Channel Attribution
Assign credit to touchpoints using multi-touch attribution models. Common approaches include time-decay (recent touches get more credit), U-shaped (first and last touches get most credit), or custom models based on your sales cycle.
Step 4: Build Predictive Scorecards
Use historical data to score leads, opportunities, and accounts based on conversion likelihood. Incorporate firmographic data, engagement signals, and behavioral patterns.
Refresh scores weekly as new data arrives.
Step 5: Create Prescriptive Playbooks
Translate analytics into recommended actions. If a deal stalls in technical evaluation for 14+ days, trigger an executive alignment call.
If email engagement drops below 10%, switch to phone or video outreach.
Organizations implementing this framework report 30-40% improvement in pipeline conversion within 6 months.
Balancing AI Efficiency with Human Connection
The analytics paradox: buyers want personalization, but 75% prefer human interaction over AI-only experiences. The solution isn't choosing between AI and humans—it's using analytics to make human interactions more valuable.
Use AI and analytics to:
- Research at scale: Let AI surface account insights, recent news, and buying signals so reps spend call time building relationships instead of researching
- Prioritize intelligently: Score leads and opportunities so reps focus on high-intent buyers who are ready for human engagement
- Personalize messaging: Use engagement data to tailor outreach while keeping the human voice authentic
- Optimize timing: Analyze response patterns to determine when prospects are most likely to engage
Reserve human time for high-value activities: discovery calls, objection handling, executive alignment, negotiation, and relationship building. Use AI-powered automation for data entry, follow-up reminders, and routine qualification.
Find Buyers Ready To Close With Apollo
Pipeline forecasting a guessing game? Apollo reveals in-market prospects with real-time intent signals and buying behavior. Built-In boosted win rates 10% with Apollo's scoring.
Start Free with Apollo →Common Sales Analytics Implementation Challenges
Three obstacles derail most sales analytics initiatives:
Data Quality and Completeness
Analytics are only as good as the underlying data. If reps don't log activities, deals lack key fields, or contact data is outdated, insights will be wrong.
Solve this with automated data capture, enrichment, and governance policies that make data entry effortless.
Adoption and Change Management
Reps resist new tools that add complexity. Successful rollouts include executive sponsorship, clear "what's in it for me" messaging, role-based training, and celebration of early wins.
Plan for 90-day adoption cycles, not instant transformation.
Analysis Paralysis
Too many metrics creates confusion. Start with 5-7 critical KPIs tied directly to revenue outcomes. Add complexity only after mastering the basics. Remember: insight without action is waste.
Sales Analytics Tools and Platform Consolidation
The average sales tech stack includes 10+ tools: CRM, sales engagement, conversation intelligence, data enrichment, forecasting, and analytics. This fragmentation creates three problems:
- Data doesn't sync between systems, creating blind spots
- Reps waste time switching contexts and entering duplicate data
- Subscription costs add up to $15,000-30,000 per rep annually
Forward-thinking organizations are consolidating to unified platforms that combine prospecting, engagement, enrichment, and analytics in one workspace. This cuts costs by 40-60% while improving data quality and user adoption.
When evaluating sales analytics tools, prioritize:
- Native integration with your CRM and sales engagement platform
- Real-time data refresh (not batch updates from yesterday)
- Role-based dashboards for reps, managers, and executives
- Mobile access for on-the-go insights
- Predictive capabilities beyond historical reporting
Measuring ROI of Sales Analytics Investments
Justify analytics spending by quantifying impact across four dimensions:
| ROI Dimension | Measurement Approach | Typical Impact |
|---|---|---|
| Revenue Growth | Incremental revenue from improved win rates and deal size | 15-25% revenue lift |
| Efficiency Gains | Time saved on admin, research, and reporting | 8-12 hours per rep per week |
| Cost Reduction | Tool consolidation savings and reduced churn | 40-60% lower tech costs |
| Forecast Accuracy | Reduction in forecast variance and missed commitments | ±5% vs. ±20% variance |
Build a business case by modeling these impacts over 12 months. Most organizations achieve payback within 4-6 months when factoring in efficiency gains and tool consolidation.
Getting Started with Sales Analytics
Start small and expand as you demonstrate value:
- Month 1: Audit current metrics and identify 3-5 critical gaps in visibility. Document current state performance (win rate, cycle time, forecast accuracy).
- Month 2: Clean up data quality issues and establish governance policies. Implement automated enrichment and data capture to reduce manual entry.
- Month 3: Deploy analytics dashboards for managers and reps. Train teams on how to interpret insights and take action. Start with descriptive analytics before adding predictive models.
- Months 4-6: Measure impact against baseline metrics. Identify what's working and iterate. Add predictive scoring and prescriptive playbooks based on patterns you discover.
Need help connecting analytics across your entire B2B sales process? Organizations using unified platforms report 2-3x faster time to value compared to stitching together point solutions.
Conclusion: Build Your Data-Driven Sales Engine
Sales analytics isn't about generating more reports. It's about making smarter decisions faster, optimizing human connection across hybrid channels, and driving predictable revenue growth.
The organizations winning in 2026 use analytics to balance AI efficiency with high-touch relationships. They've broken down data silos, consolidated their tech stack, and built cultures where every decision starts with data.
Start by focusing on the metrics that predict revenue, not vanity numbers. Clean up your data foundation.
Unify your tools into a single workspace. Then use analytics to make every rep more productive and every buyer interaction more valuable.
Ready to transform your sales analytics? Schedule a demo to see how Apollo's unified platform combines prospecting, engagement, enrichment, and analytics in one workspace—cutting your tech stack while boosting revenue by up to 2.5x.
Prove Apollo's ROI In Your First 30 Days
Budget approval stuck on unclear metrics? Apollo tracks every touch to closed revenue with built-in attribution. Built-In increased win rates 10% and ACV 10% with measurable signals.
Start Free with Apollo →Don't miss these
Sales
Inbound vs Outbound Marketing: Which Strategy Wins?
Sales
What Is a Sales Funnel? The Non-Linear Revenue Framework for 2026
Sales
What Is a Go-to-Market Strategy? The 2026 GTM Playbook
See Apollo in action
We'd love to show how Apollo can help you sell better.
By submitting this form, you will receive information, tips, and promotions from Apollo. To learn more, see our Privacy Statement.
4.7/5 based on 9,015 reviews
