
What Factors Affect Sales? The 2026 B2B Performance Guide
Most sales teams optimize the wrong things. They refine their pitch, polish their decks, and train on objection handling — while buyers have already made up their minds. According to Corporate Visions, 81% of buyers select their vendor before ever engaging with a salesperson. The factors that actually affect sales happen much earlier than most teams realize.
This guide covers the real drivers of B2B sales performance in 2026 — from pre-contact brand presence to deal-stage execution — and shows you exactly where to focus your energy.
Research Less, Close More With Apollo
Tired of burning hours verifying emails and hunting down contact info? Apollo delivers 96% accurate business contacts instantly, so your reps spend time selling — not searching. Join 550K+ companies building pipeline faster.
Start Free with Apollo →Key Takeaways
- Buyers shortlist vendors before any sales contact, making pre-contact content and brand visibility critical sales factors.
- Buying committees are larger and more complex, requiring multi-stakeholder engagement strategies.
- Digital channels now dominate the B2B buying journey, demanding consistent multi-channel presence.
- Personalization directly increases purchase likelihood and is now a baseline buyer expectation.
- AI transparency has become a measurable evaluation factor — vague AI claims can stall or kill deals.
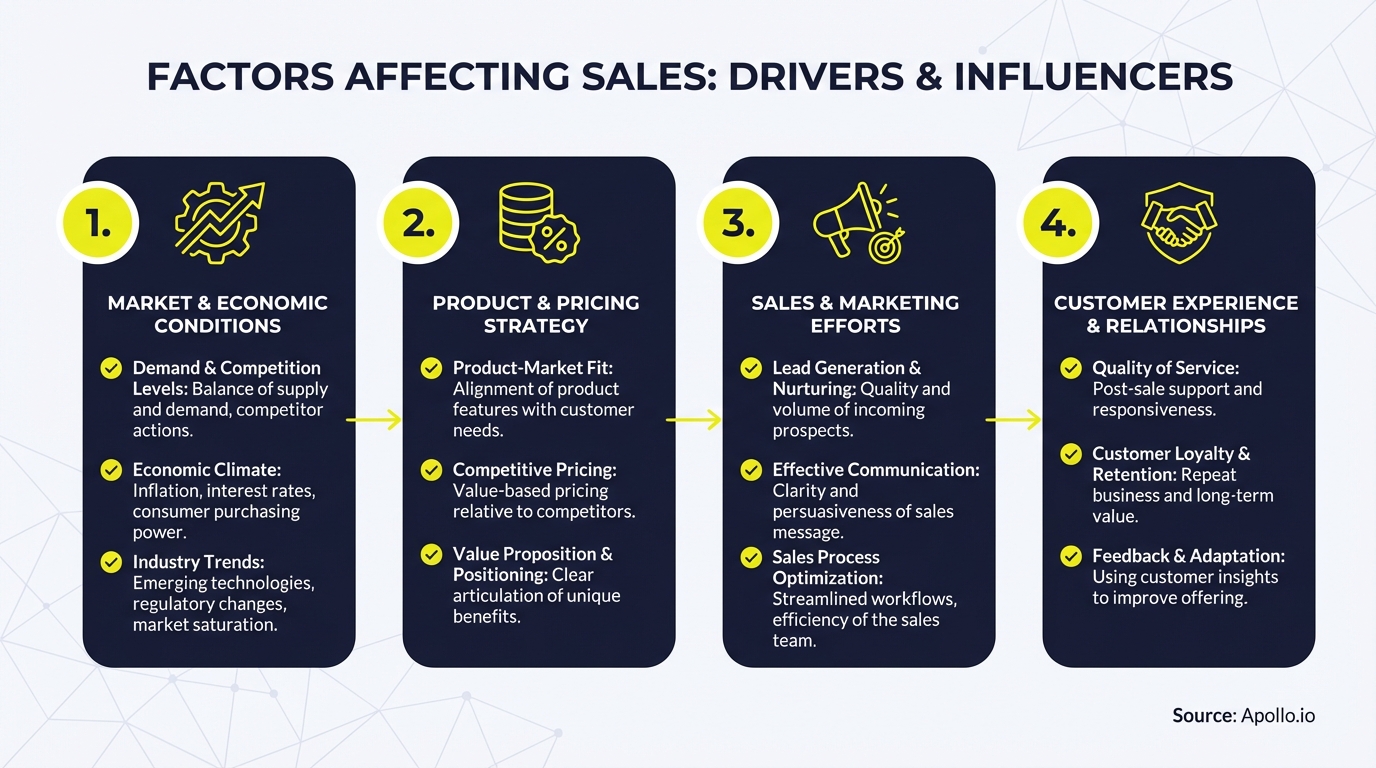
What Are the Core Factors That Affect Sales Performance?
Sales performance is determined by a combination of internal capabilities and external conditions. Understanding both is essential for building a reliable sales pipeline that converts consistently.
| Factor Category | Key Elements | Impact Area |
|---|---|---|
| Pre-Contact Brand Presence | Content, SEO, peer reviews, social proof | Shortlist inclusion |
| Product-Market Fit | ICP alignment, value proposition clarity | Conversion rate |
| Pricing Strategy | Model, anchoring, competitive positioning | Deal velocity and size |
| Sales Team Capability | Skills, tools, enablement, AI fluency | Win rate |
| Buyer Experience | Personalization, self-serve, rep support | Deal quality and retention |
| Multi-Channel Execution | Channel mix, message consistency | Pipeline coverage |
| External Conditions | Economy, regulation, competitive landscape | Market timing |
Why Pre-Contact Brand Presence Is Now the #1 Sales Factor
The buying decision is largely made before your rep sends a single email. Research from Qobra shows that 91% of buyers are familiar with the vendor and 85% have largely defined their purchase requirements before speaking to a salesperson. If your brand isn't already in their consideration set, you're competing for scraps.
The practical implication: SEO content, third-party reviews, peer recommendations, and social proof are not marketing activities — they are direct sales factors. Teams that treat brand-building as separate from sales are leaving pipeline on the table.
What drives shortlist inclusion:
- High-ranking educational content that answers buyer questions during research
- Strong presence on review platforms and peer communities
- Consistent messaging across all digital touchpoints
- Clear, specific AI feature explanations (vague AI claims reduce shortlist trust)
- Case studies and proof points from recognizable customers
Turn Funnel Guesswork Into Pipeline Wins
Tired of watching marketing leads stall before they ever reach your pipeline? Apollo surfaces high-intent prospects and arms your reps with the signals to act first. Top teams close more with less guesswork.
Start Free with Apollo →How Buying Committee Complexity Affects Win Rates
B2B deals are no longer won by convincing one champion. According to TryKondo, buying committees now average 25 stakeholders, up from 16 in 2017. Each stakeholder brings different priorities, risk tolerances, and information needs.
Sales teams that fail to map and engage the full buying committee consistently lose to sellers who do. Understanding B2B sales dynamics today means building multi-threaded account strategies from day one.
Multi-stakeholder engagement framework:
- Economic buyer: ROI, cost reduction, business outcomes
- Technical buyer: Integration, security, data governance, AI transparency
- End user: Workflow fit, ease of adoption, time savings
- Legal/compliance: Regulatory alignment, vendor risk
- Champion: Internal advocacy, competitive comparison content
"Now we know exactly what we want to say and who we want to say it to. It's just a matter of going into Apollo and making it happen."
How Digital Channels and Personalization Drive Sales Outcomes
Digital-first buying is no longer a trend — it's the default. Valve reports that an estimated 80% of B2B sales interactions will occur through digital channels. Yet presence alone isn't enough: message consistency across those channels determines whether you build trust or create confusion.
Personalization is where digital execution either wins or loses deals. Data from Sales Odyssey shows that 78% of buyers are more likely to purchase from businesses offering personalized experiences. Generic outreach in a high-volume digital environment is noise.
Struggling to reach the right contacts with personalized messaging at scale? Automate your multi-channel sequences with Apollo and deliver relevance at every touchpoint.
"With this kind of AI system, my BDRs can send 10x more personalized emails. Their productivity and growth has skyrocketed."

How Sales Team Capabilities and Technology Affect Revenue
The gap between high-performing and average sales teams is increasingly a technology and enablement gap, not just a skills gap. Sales productivity depends on reps spending time on high-value activities — and that requires the right tools removing friction from the process.
Key capability factors that directly affect sales outcomes:
- Prospecting accuracy: Reaching verified contacts at the right companies shortens sales cycles. Need better targeting? Search Apollo's 224M+ contacts with 65+ filters to find your exact ICP.
- AI fluency: Reps who use AI for research, personalization, and call prep consistently outperform those who don't. See how sales analytics can sharpen your team's performance.
- Tech stack consolidation: Fragmented tools create data silos and slow execution. A unified platform keeps data, engagement, and deal management in sync.
- Coaching and enablement: Regular call review and skills development compound over time — explore how a sales trainer can systematically improve rep output.
What External Factors Affect Sales Performance?
No sales strategy operates in a vacuum. External factors can accelerate or undermine even the best-executed playbooks. Understanding these forces helps teams adapt their sales funnel strategy when conditions shift.

| External Factor | Sales Impact | Recommended Response |
|---|---|---|
| Economic conditions | Budget freezes, longer approval cycles | Shift messaging to ROI and cost reduction |
| Competitive landscape | Increased evaluation scrutiny, comparison shopping | Strengthen differentiation content and proof points |
| Regulatory changes | New compliance requirements in buyer's industry | Develop compliance-focused sales materials |
| Technology shifts | AI expectations raise evaluation bar | Provide specific, transparent AI capability documentation |
| Buyer behavior evolution | More self-serve research, larger committees | Invest in content that supports independent evaluation |
How to Measure and Optimize the Factors Affecting Your Sales
Identifying factors is only useful if you can measure their impact and improve them systematically. Tracking the right sales KPIs across each factor gives you a clear optimization roadmap.
Factor-to-metric mapping:
- Pre-contact brand presence: Organic traffic share, review volume/rating, shortlist inclusion rate
- Product-market fit: Win rate by segment, churn rate, NPS score
- Pricing strategy: Average deal size, discount rate, price objection frequency
- Sales team capability: Meetings booked per rep, call-to-meeting conversion, ramp time
- Buyer experience: Sales cycle length, multi-thread score, deal quality (expansion rate)
- Channel mix: Pipeline by source, reply rates by channel, cost per opportunity
For a structured approach to revenue optimization, explore the revenue operations framework that ties these metrics into a unified operating model.
Conclusion: Control the Factors You Can, Prepare for the Ones You Can't
The factors that affect sales span pre-contact brand building, buying committee dynamics, digital channel execution, team capability, and external market forces. The teams winning in 2026 treat all of these as levers — not luck.
The most actionable shift: stop optimizing only what happens during the sales conversation and start investing in what happens before your rep ever reaches out. Build content that earns shortlist inclusion, personalize at scale, and give every stakeholder the proof they need to say yes.
Apollo brings together prospecting, engagement, and deal intelligence in one unified platform — so every factor in your control is optimized from a single workspace. Get Leads Now and start turning sales factors into revenue.
Apollo Delivers ROI You Can Prove
Budget approval stuck on unclear pipeline metrics? Apollo gives revenue teams measurable wins fast — more meetings, stronger deal velocity, real numbers. Leadium 3x'd annual revenue. Start yours today.
Start Free with Apollo →Don't miss these
Sales
Inbound vs Outbound Marketing: Which Strategy Wins?
Sales
What Is a Sales Funnel? The Non-Linear Revenue Framework for 2026
Sales
What Is a Go-to-Market Strategy? The 2026 GTM Playbook
See Apollo in action
We'd love to show how Apollo can help you sell better.
By submitting this form, you will receive information, tips, and promotions from Apollo. To learn more, see our Privacy Statement.
4.7/5 based on 9,015 reviews
