
Sales Velocity Formula: How to Calculate and Optimize It
Sales velocity measures how quickly revenue flows through your pipeline. In 2026, with buying cycles averaging 10.1 months and most vendors selected before sales engagement even begins, understanding this formula helps teams identify exactly where deals stall and which levers accelerate revenue.
This guide shows you how to calculate sales velocity, benchmark your performance against industry standards, and optimize each variable to compound your growth.
More Pipeline, Less Manual Hunting
Tired of spending hours verifying contacts only to hit dead ends? Apollo surfaces high-quality leads instantly with 96% email accuracy. Join 550K+ companies turning research time into real selling time.
Start Free with Apollo →Key Takeaways
- Sales velocity measures revenue generation speed using four variables: opportunities, win rate, deal size, and cycle length
- Industry benchmarks range from $743/day to $2,456/day, helping you identify performance gaps
- Small improvements across all four levers compound to create exponential velocity gains
- RevOps teams now track velocity weekly as a leading indicator of forecast health
- Modern buyers complete most decisions before contacting sales, shifting how teams build pipeline
What Is the Sales Velocity Formula?
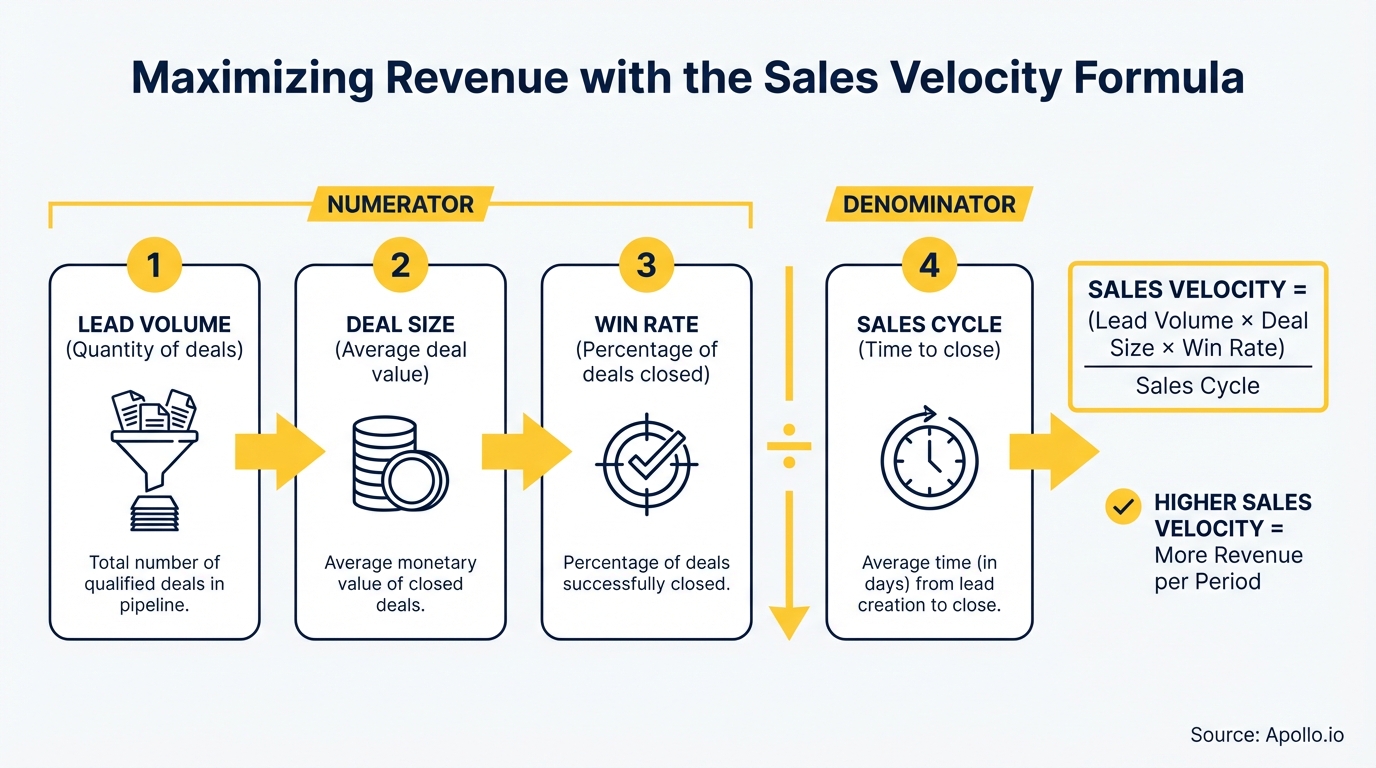
The sales velocity formula measures how fast your sales team generates revenue. According to Monday.com, it is typically calculated using the formula: (Number of Qualified Opportunities × Average Deal Size × Win Rate) ÷ Length of Sales Cycle. The output represents your daily revenue generation rate.
This metric matters because it reveals operational efficiency beyond just closed deals. A team closing $1M monthly with a 30-day cycle generates higher velocity than one closing the same amount in 90 days.
Understanding your velocity helps you diagnose constraints and prioritize improvements. For example, if your cycle length is twice the industry average, that's where optimization will deliver the biggest impact.
The formula connects directly to sales acceleration frameworks and modern sales analytics approaches that emphasize leading indicators over lagging metrics.
How Do You Calculate Sales Velocity?
Calculate sales velocity by multiplying your qualified opportunities by average deal value and win rate, then dividing by your average sales cycle length in days. Here's a practical example: if you have 50 opportunities worth $10,000 each, a 20% win rate, and a 60-day cycle, your velocity is (50 × $10,000 × 0.20) ÷ 60 = $1,667 per day.
Breaking down each component:
- Qualified Opportunities: Count only deals that match your ICP and have budget, authority, need, and timeline. Research from Sproutworth shows the average number of opportunities per representative increased by 13% from 2023 to 2024.
- Average Deal Size: Calculate the mean contract value across closed deals. Data from SaaS Capital indicates the median ACV for private SaaS companies was $26,265 in a 2025 survey, up from $22,357 the previous year.
- Win Rate: Divide closed-won deals by total opportunities. Kondo reports the average B2B sales close rate is 29%, with a win rate around 21%.
- Sales Cycle Length: Measure days from opportunity creation to closed-won. Track this by deal size segment for accuracy.
Can't track your opportunities effectively? Get complete pipeline visibility with Apollo's deal management platform.

What Are the Industry Benchmarks for Sales Velocity in 2026?
Sales velocity benchmarks vary significantly by industry. According to First Page Sage, median pipeline velocity across industries ranges from $743/day in Marketing & Advertising to $2,456/day in Real Estate & Construction. These benchmarks help you identify whether your constraints are deal size, cycle length, or conversion efficiency.
Here's how velocity breaks down by industry:
| Industry | Median Velocity/Day | Primary Driver |
|---|---|---|
| Real Estate & Construction | $2,456 | High deal values |
| Technology & Software | $1,847 | Balanced across levers |
| Financial Services | $1,523 | Strong win rates |
| Healthcare | $1,205 | Longer cycles, higher ACV |
| Marketing & Advertising | $743 | Volume-based model |
RevOps leaders now segment velocity by ICP, channel, and deal band rather than using one company-wide number. This granularity reveals which motions drive growth and where pipeline stalls.
How Do Sales Leaders Optimize Each Velocity Variable?
Optimizing sales velocity requires a balanced approach across all four levers. Pushing one variable often reduces another.
For example, flooding your pipeline with low-quality opportunities increases volume but typically crashes win rate and extends cycle length.
Increase Qualified Opportunities:
- Deploy account-based prospecting with intent signals to find in-market buyers
- Build category-defining content that earns Day One shortlist placement
- Use multi-channel sequences across email, phone, and social outreach
- Implement lead scoring to prioritize high-fit accounts
Improve Win Rate:
- Create battle cards for common competitor scenarios
- Develop proven sales pitch frameworks that address buyer priorities
- Build mutual action plans to maintain deal momentum
- Leverage conversation intelligence to coach reps on winning behaviors
Grow Average Deal Size:
- Introduce tiered packaging that encourages upsells
- Train Account Executives on high-ticket sales techniques
- Add multi-year contract options with incentives
- Bundle complementary products to increase deal value
Reduce Sales Cycle Length:
- Provide self-serve resources that answer buyer questions before calls
- Implement automated meeting scheduling to eliminate coordination delays
- Create pre-approved security and legal documentation
- Use ROI calculators that build business cases for buyers
Struggling to manage complex deals across multiple stages? Let Apollo's AI call assistant handle meeting summaries and next steps automatically.
Turn Blind Forecasts Into Pipeline Clarity
Pipeline forecasting a guessing game because deal stages shift without warning? Apollo surfaces real-time buyer signals so your team always knows where opportunities stand. Join 90K paying customers closing with confidence.
Schedule a Demo →How Do SDRs and AEs Use Sales Velocity to Hit Quota?
SDRs and Account Executives use sales velocity differently based on their role in the pipeline. SDRs focus on opportunity volume and quality, ensuring they pass deals that convert at target win rates.
AEs concentrate on shortening cycles and expanding deal sizes through strategic account management.
For SDRs building pipeline:
- Track velocity by source channel to identify which prospecting methods generate fastest-moving deals
- Monitor qualification criteria to ensure opportunities meet ICP standards
- Measure time-to-first-meeting to spot friction in outreach sequences
- Use intent data to prioritize accounts showing buying signals
For Account Executives closing deals:
- Segment velocity by deal size to understand which opportunities deserve immediate focus
- Identify stage-by-stage aging to intervene on stalled deals before they die
- Benchmark cycle length against historical data to forecast close dates accurately
- Apply proven objection handling frameworks that compress decision timelines
Sales Leaders coaching teams use velocity cohorts to diagnose performance gaps. If one rep's cycle length is 50% longer than the team average, that signals a coaching opportunity on deal progression tactics.
What Role Does Content Play in Sales Velocity?
Content directly influences three of the four velocity variables: opportunities, win rate, and cycle length. In 2026, buyers complete most of their evaluation before contacting sales, making pre-contact content a primary velocity driver.
Content that increases opportunities:
- Category-defining thought leadership that positions your solution as the default choice
- Problem-focused educational content that attracts in-market buyers
- Interactive tools like ROI calculators that capture intent signals
- Industry-specific case studies that demonstrate proven results
Content that improves win rate:
- Detailed comparison pages that address competitive evaluation
- Implementation guides that reduce perceived switching costs
- Security and compliance documentation that accelerates procurement
- Executive briefing decks that build stakeholder alignment
Content that shortens cycles:
- Self-serve product demos that answer technical questions
- Pricing transparency that eliminates discovery call delays
- Customer proof points organized by industry and use case
- Mutual action plan templates that structure the buying process
The key is mapping content to specific velocity constraints. If your cycle length is the bottleneck, prioritize assets that enable buyer self-service and reduce dependency on sales availability.

How Do You Track Sales Velocity as an Operating Metric?
Leading revenue operations teams track sales velocity weekly as a forecast health indicator rather than a quarterly KPI. This operational cadence catches pipeline problems before they impact the quarter.
Build a velocity dashboard with these components:
- Velocity by Segment: Track separate calculations for SMB, mid-market, and enterprise to spot mix shifts
- Velocity by Source: Compare inbound, outbound, partner, and expansion motion performance
- Stage Aging Analysis: Identify where deals stall by measuring time in each pipeline stage
- Cohort Trends: Monitor how velocity changes for deals created in different time periods
- Rep Performance: Compare individual contributor velocity to identify coaching opportunities
Connect your velocity tracking to revenue operations systems and key performance indicators for comprehensive pipeline visibility.
Set alerts for velocity drops of 15% or more week-over-week. These early warnings let you diagnose issues like declining win rates or lengthening cycles before they compound into missed targets.
Start Accelerating Your Sales Velocity Today
Sales velocity shows you exactly where revenue generation slows down and which improvements deliver the biggest impact. By tracking this metric weekly and optimizing all four variables together, you create compounding gains that accelerate growth quarter after quarter.
The teams winning in 2026 treat velocity as an operating system, not a vanity metric. They segment by ICP and channel, measure weekly instead of quarterly, and use data to guide every optimization decision.
Apollo consolidates the sales intelligence, engagement automation, and deal management tools you need to improve every velocity variable. Our unified platform helps teams reduce the complexity of managing multiple tools while providing the data visibility required to diagnose constraints and track improvements.
As Collin Stewart from Predictable Revenue puts it: "We reduced the complexity of three tools into one."
Ready to accelerate your pipeline? Start Your Free Trial
Prove Pipeline ROI With Apollo
Struggling to justify your sales tools when leadership wants hard numbers? Apollo surfaces measurable pipeline impact so budget approvals stop stalling. Leadium 3x'd their revenue — see your ROI from day one.
Start Free with Apollo →Don't miss these
Sales
Inbound vs Outbound Marketing: Which Strategy Wins?
Sales
What Is a Sales Funnel? The Non-Linear Revenue Framework for 2026
Sales
What Is a Go-to-Market Strategy? The 2026 GTM Playbook
See Apollo in action
We'd love to show how Apollo can help you sell better.
By submitting this form, you will receive information, tips, and promotions from Apollo. To learn more, see our Privacy Statement.
4.7/5 based on 9,015 reviews
