
Sales Growth Calculator: Model Revenue and Hit Your Targets
Sales leaders face mounting pressure to forecast revenue accurately while budgets shrink and buying cycles stretch longer. A sales growth calculator transforms guesswork into data-driven planning by modeling pipeline velocity, conversion rates, and channel mix to predict achievable revenue targets.
Whether you're a RevOps leader building next quarter's forecast or a founder justifying headcount expansion, the right calculator turns assumptions into defensible business cases that align sales, marketing, and finance teams around realistic growth targets.
According to Ebsta, in 2023, 73% of sales representatives missed their H2 quotas; in 2024, an average of 69% are still falling short. This gap between quota and reality makes sales analytics and forecasting tools essential for setting achievable targets backed by actual pipeline math.
Research Less, Pipeline More With Apollo
Tired of your reps burning hours verifying contact info instead of selling? Apollo delivers 224M verified contacts so your team skips the research and gets straight to the conversation. Join 550K+ companies building pipeline faster.
Start Free with Apollo →Key Takeaways
- A sales growth calculator models pipeline coverage, win rates, and deal velocity to forecast realistic revenue targets and identify gaps before quarters end
- CFO-grade calculators include sensitivity analysis, CAC payback periods, and multi-touch attribution assumptions to support budget requests and board presentations
- Modern calculators output shareable business cases, implementation plans, and scenario comparisons that align cross-functional teams around growth investments
- RevOps teams use calculators to quantify the impact of process changes, tool consolidation, and channel mix optimization on quota attainment
What Is a Sales Growth Calculator?
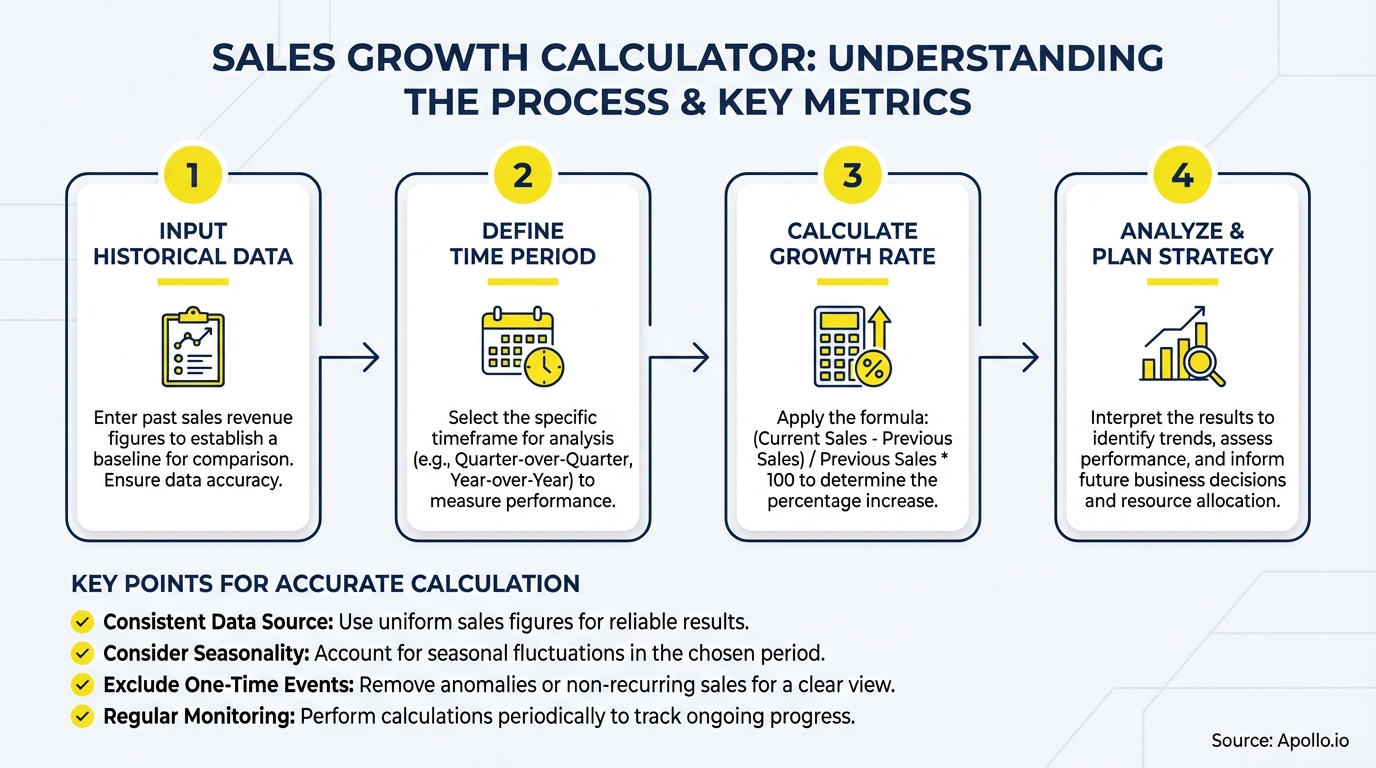
A sales growth calculator is a forecasting tool that uses historical performance data, pipeline metrics, and conversion assumptions to project future revenue and identify the inputs needed to hit growth targets. It translates sales fundamentals like lead volume, win rate, average contract value, and sales cycle length into revenue outcomes.
The best calculators go beyond simple arithmetic. They model controllable levers (pipeline coverage ratios, stage conversion rates, channel mix), incorporate industry benchmarks, and output scenario analyses that show best-case, base-case, and worst-case outcomes. This lets revenue operations teams stress-test forecasts and quantify the impact of strategic changes before committing resources.
Research from Gradient Works shows win rates have decreased to 17-20% (2023, Winning by Design), making accurate pipeline math critical. When conversion rates decline, teams need precise modeling to understand whether gaps stem from insufficient lead volume, poor qualification, or elongated sales cycles.
Why Do Sales Leaders Need Growth Calculators in 2026?
Budget constraints and digital buying preferences are reshaping how companies plan growth. Marketing budgets have fallen while sales cycles have lengthened, creating a planning gap between ambitious targets and available resources.
Calculators bridge this gap by quantifying what's realistic given current capacity and conversion rates.
According to SME Today, 73% of B2B buyers purchase through digital channels, contrasting with 54% of B2C buyers who prefer in-person shopping. This shift demands calculators that model omnichannel journeys rather than single-touch attribution. Buyers interact across email, social, webinars, self-serve trials, and sales calls before converting.
A study by Demand Gen Report found sellers who effectively partner with AI tools are 3.7 times more likely to meet their quota than those who do not, according to a Gartner survey from January to March 2024. Modern calculators integrate AI-driven insights to recommend optimal channel allocation and surface patterns in high-performing segments.
What Inputs Do Sales Growth Calculators Use?
Effective calculators start with core pipeline metrics and layer in assumptions about conversion efficiency and market dynamics. The quality of outputs depends entirely on input accuracy and realistic assumptions about team capacity and market conditions.
Essential Pipeline Metrics
- Current pipeline value: Total dollar value of open opportunities by stage
- Pipeline coverage ratio: Pipeline value divided by quota (typically 3-5x for healthy coverage)
- Stage conversion rates: Percentage of deals advancing from each stage to the next
- Average deal size (ACV): Mean contract value across closed-won deals
- Sales cycle length: Days from lead creation to closed-won (varies by deal size and segment)
- Win rate: Percentage of qualified opportunities that close successfully
Capacity and Efficiency Assumptions
- Reps per segment: SDR, AE, and customer success headcount allocated to each product line or region
- Quota per rep: Individual revenue targets based on historical attainment and market maturity
- Ramp time: Months for new hires to reach full productivity (typically 3-6 months for AEs)
- Channel mix: Percentage of pipeline sourced from inbound, outbound, partnerships, or product-led motions
Struggling to maintain clean pipeline data across your team? Consolidate deal tracking, forecasting, and pipeline health monitoring in one workspace with Apollo.
Turn Funnel Guesswork Into Forecast Confidence
Pipeline forecasting a guessing game because leads stall before they ever reach your team? Apollo surfaces high-intent prospects so your pipeline reflects real opportunities. Join 90K paying customers forecasting with confidence.
Schedule a Demo →How Do RevOps Teams Use Growth Calculators?
RevOps leaders use calculators to model the impact of operational changes before rolling them out. When considering process improvements, tool investments, or territory redesigns, calculators quantify expected lift in pipeline generation, conversion rates, or sales velocity.
For example, if RevOps wants to justify consolidating sales tools to reduce tech stack complexity, they can model time savings per rep, reduction in data entry errors, and improved pipeline visibility. The calculator outputs become the business case for executive approval.
Common RevOps calculator use cases include:

- Headcount planning: Modeling how many reps are needed to hit revenue targets given current win rates and quotas
- Territory design: Projecting coverage and attainment across geographic or vertical segments
- Tool ROI: Quantifying productivity gains from sales automation software or data enrichment platforms
- Channel optimization: Testing scenarios where budget shifts from field sales to digital or partner-led motions
- Process improvements: Estimating impact of reducing sales cycle length by one week or improving stage 2-3 conversion by five percentage points
What Outputs Should a CFO-Grade Calculator Provide?
Finance teams demand calculators that produce audit-ready outputs with transparent assumptions and sensitivity ranges. A CFO-grade tool goes beyond point estimates to show confidence intervals, payback periods, and scenario comparisons.
| Output Type | Description | Business Use |
|---|---|---|
| Incremental Pipeline | Additional pipeline dollars needed to close revenue gap | Align marketing spend to pipeline generation targets |
| Incremental Revenue | Expected new ARR or bookings from proposed changes | Justify headcount, tools, or channel investments |
| CAC Payback Period | Months to recover customer acquisition cost from gross margin | Evaluate efficiency of growth investments |
| ROI by Channel | Return on investment for inbound, outbound, partnerships, product-led | Optimize budget allocation across go-to-market motions |
| Sensitivity Analysis | Best-case, base-case, worst-case scenarios with probability ranges | Risk assessment for board presentations and budget approvals |
| Attribution Confidence | Reliability score for multi-touch attribution assumptions | Set realistic expectations for measurement accuracy |
The calculator should export these outputs as shareable PDFs, CSV files, or presentation-ready slides. This enables RevOps to distribute business cases to finance, sales leadership, and executive teams without manual reformatting.
How Do SDRs and AEs Benefit From Growth Calculators?
Front-line reps use simplified calculator views to understand what activity levels are required to hit quota. When SDRs see that their current connect rate and meeting-set conversion require 120 outbound touches per day to generate sufficient pipeline, they can adjust daily activity plans or request support to improve conversion rates.
For AEs managing multiple opportunities, calculators clarify pipeline coverage requirements. If an AE carries a $500K quarterly quota with a 25% win rate and $50K average deal size, they need $2M in qualified pipeline (4x coverage).
The calculator makes this math visible and actionable.
Sales managers use team-level calculators to identify at-risk reps early in the quarter. When a rep's pipeline falls below required coverage thresholds, managers can intervene with coaching, lead redistribution, or joint prospecting initiatives before the gap becomes unrecoverable.
Spending too much time on manual prospecting instead of selling? Automate outreach sequences and focus selling time on qualified conversations with Apollo's AI-powered platform.
What Role Do Benchmarks Play in Calculator Accuracy?
Industry benchmarks provide reality checks for assumptions and help teams identify performance gaps. A calculator that shows your win rate is 15% while industry average is 22% signals a conversion problem that undermines growth plans.
Benchmark categories to incorporate include:
- Win rate by deal size: Smaller deals typically convert at higher rates (30-40%) while enterprise deals drop to 15-20%
- Sales cycle by ACV: $10K deals close in 30-60 days; $100K+ deals stretch to 6-12 months
- Pipeline coverage ratios: Early-stage companies need 5-6x coverage; mature orgs with predictable conversion operate at 3-4x
- Quota attainment distributions: Healthy teams see 60-70% of reps at 80%+ attainment
- Ramp time by role: SDRs reach productivity in 1-2 months; AEs need 3-6 months depending on deal complexity
Embedding benchmarks directly into calculator interfaces helps users spot outliers. When someone inputs a 60% win rate for enterprise deals, the tool can flag this as unusually optimistic and suggest a more conservative assumption.

Conclusion
A sales growth calculator transforms revenue planning from aspirational targets into data-driven roadmaps. By modeling pipeline coverage, conversion efficiency, and channel mix scenarios, sales leaders build defensible forecasts that align cross-functional teams and identify gaps before quarters slip.
The best calculators combine historical performance data with industry benchmarks, output CFO-grade sensitivity analyses, and export shareable business cases that accelerate internal approvals. For RevOps teams juggling tool consolidation, headcount planning, and process optimization, calculators quantify the impact of strategic changes before resources are committed.
In 2026, with budgets flat and sales cycles lengthening, growth requires precision. Calculators give SDRs activity targets, AEs pipeline coverage clarity, and executives confidence that plans are grounded in realistic assumptions rather than wishful thinking.
Ready to consolidate your sales tech stack and improve forecast accuracy? Request a Demo to see how Apollo unifies prospecting, engagement, and pipeline management in one workspace, reducing tool complexity while improving data quality for better growth planning.
Prove Pipeline ROI Before Next Quarter
Budget approval stuck on unclear metrics? Apollo delivers measurable pipeline impact your leadership can see — fast. Teams like Leadium 3x'd their revenue after making the switch. Start your free trial today.
Start Free with Apollo →Don't miss these
Sales
Inbound vs Outbound Marketing: Which Strategy Wins?
Sales
What Is a Sales Funnel? The Non-Linear Revenue Framework for 2026
Sales
What Is a Go-to-Market Strategy? The 2026 GTM Playbook
See Apollo in action
We'd love to show how Apollo can help you sell better.
By submitting this form, you will receive information, tips, and promotions from Apollo. To learn more, see our Privacy Statement.
4.7/5 based on 9,015 reviews
