
How Revenue Teams Measure Agentic GTM ROI in the First 6 Months
Agentic GTM is no longer a pilot project. According to a Protiviti study, 68% of organizations will have integrated autonomous or semi-autonomous agents into core operations by 2026. Yet CFOs aren't celebrating agent activity reports. They want pipeline, reduced CAC, and measurable throughput gains inside a defined window. The first 6 months is that window.
Understanding what revenue operations actually drives matters here: without a measurement framework tied to business outcomes, agentic GTM investments get defunded. This guide gives RevOps leaders, CROs, and marketing teams a CFO-defensible ROI blueprint for months 0 through 6.
Scale Pipeline Without the Manual Grind
Tired of your reps burning hours on research instead of selling? Apollo surfaces verified contacts and automates outreach so your team scales without the chaos. Join 600K+ companies building predictable pipeline.
Start Free with Apollo →Key Takeaways
- Measure leading indicators first (speed-to-lead, meetings booked, MQL-to-SQL rate) before expecting closed-won revenue in month 6.
- Governance and observability are part of the ROI case, not separate from it. No AgentOps = hidden costs that erase early gains.
- Organizations deploying agentic systems project an average ROI of 171%, but only teams with structured measurement frameworks realize it.
- RevOps leaders should build a 3-tier KPI ladder: Inputs (months 0-2), Outputs (months 2-4), Outcomes (months 4-6).
- "Agent actions" reported by vendors are not ROI. Pipeline created, cycle time compression, and win rate lift are.
Why Do Most Agentic GTM ROI Models Fail in the First 6 Months?
Most models fail because they measure activity instead of business outcomes. Gartner warned in 2024 that at least 30% of GenAI projects would be abandoned after proof-of-concept due to unclear business value, escalating costs, and poor data quality.
Revenue teams that track "agent actions" or "hours saved" without connecting those inputs to pipeline and revenue are building a false-positive ROI case.
The core problem: productivity gains don't automatically convert into revenue. Saved rep time only creates value if that capacity flows into qualified outreach, booked meetings, and progressed opportunities. Without that causal chain documented, CFOs rightfully question the investment. According to research on agentic AI transformation, 90% of companies utilizing agentic AI report improved workflows, but only when addressing specific, measurable problems.
What Is the 0-6 Month KPI Ladder for Agentic GTM ROI?
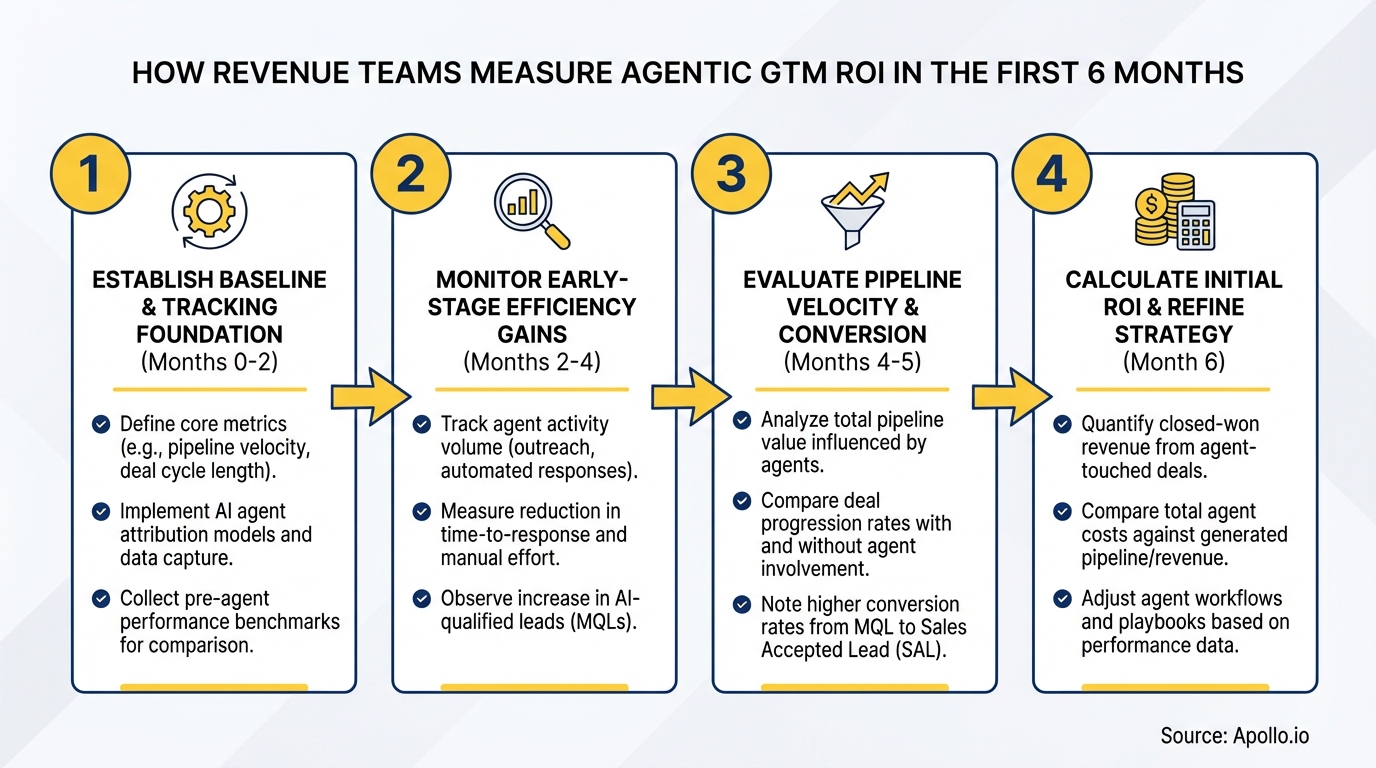
The KPI ladder organizes metrics into three tiers: Inputs, Outputs, and Outcomes. Each tier maps to a time window, giving RevOps a structured measurement progression that CFOs can follow.
| Tier | Time Window | Key Metrics | What It Proves |
|---|---|---|---|
| Inputs | Months 0-2 | Agent usage rate, content output volume, speed-to-lead, data quality score | Adoption is real; baseline is set |
| Outputs | Months 2-4 | Meetings booked, MQL-to-SQL conversion, outreach throughput, sequence reply rates | Agents are generating pipeline activity |
| Outcomes | Months 4-6 | Pipeline created, CAC, sales cycle length, opp creation rate, early win rate | Business impact is defensible |
Research from Landbase shows organizations deploying agentic systems project an average ROI of 171%, with U.S. companies anticipating an even higher 192%. Teams that reach those numbers build the ladder above before launch, not after. Understanding how sales analytics drives revenue growth is foundational to structuring this measurement framework correctly.
Struggling to build pipeline visibility across your agentic workflows? Track every stage with Apollo's sales pipeline tools.
How Do RevOps Leaders Build Governance Into the ROI Model from Week 0?
RevOps leaders build governance into ROI by treating audit trails, data quality controls, and error rates as measurable cost factors, not compliance overhead. Lack of AgentOps observability creates hidden costs: brand risk, compliance rework, and escalation rates that erode throughput gains faster than they accumulate.
Your Week 0 governance checklist should include:
- Data quality baseline: Establish accuracy benchmarks before agents run. Bad input data produces bad agent output and inflates error rates.
- Tool-use audit logs: Every agent action should be traceable. This protects your ROI narrative if outputs are questioned.
- Brand and compliance guardrails: Define what agents can and cannot generate or send without human review.
- Escalation rate tracking: Monitor how often agents hand off to humans. High escalation rates signal process gaps, not agent capability.
- Stage gates at day 45, 90, 180: Predefined thresholds for scale vs. stop decisions prevent sunk-cost bias from delaying a kill decision.
A well-structured revenue operations framework bakes these controls in from day one, keeping your ROI model clean and defensible across all six months.

What Metrics Do SDRs and Revenue Leaders Track to Prove Early ROI?
SDRs and revenue leaders focus on speed-to-lead, meetings booked per rep, and MQL-to-SQL conversion as their primary early ROI signals. These metrics respond to agentic tooling within the first 60-90 days, making them the strongest leading indicators available before pipeline matures.
For SDRs, the clearest early signals are:
- Time from inbound signal to first outreach (speed-to-lead)
- Meetings booked per week vs. pre-agent baseline
- Sequence reply rates across channels
- Accounts researched per hour (throughput gain)
For revenue leaders and CROs, the 90-180 day signals that matter most are pipeline coverage ratio, opp creation rate, and early-stage cycle time. According to Aligned Automation, 51% of organizations are now achieving time-to-market from idea to production within 3-6 months, up from 47% in 2024, a signal that instrumentation is maturing quickly.
For AEs managing active deals, the relevant agent-driven metric is cycle time compression: are opportunities progressing faster through stages where agents handle research, follow-up, or content generation? Pair this with win rate data at month 6 to complete the outcome layer of your KPI ladder. Explore how the sales acceleration formula structures these metrics for maximum revenue impact.
Spending too much rep time on manual research before each outreach? Automate prospecting and outreach workflows with Apollo's AI sales automation.
Turn Funnel Guesswork Into Real Pipeline
Tired of watching marketing leads stall before they ever reach your pipeline? Apollo surfaces in-market buyers with verified contact data so your team acts on real signals, not hunches. Nearly 100K paying customers have made forecasting feel predictable again.
Start Free with Apollo →How Should Revenue Teams Attribute Pipeline to Agents Without Creating False Positives?
Revenue teams should attribute pipeline to agents using a three-category model: agent-sourced (agent initiated the contact and booked the meeting), agent-influenced (agent assisted a human action that led to pipeline), and agent-assisted (agent supported a step in an existing opportunity). Without this taxonomy, teams either over-claim agent ROI or undercount it.
Practical attribution steps:
- Tag every agent-initiated outreach at the sequence level in your CRM.
- Track which opportunities had agent touchpoints at each stage.
- Run a holdout group (reps without agent tooling) for the first 90 days to establish a causal baseline.
- Report agent-sourced and agent-influenced pipeline separately on your ROI scorecard.
Data from Deepsense.ai shows AI leaders have achieved a 10-25% increase in EBITDA by integrating agents across core workflows. That result requires clean attribution from the start. Teams that conflate agent activity with agent-sourced pipeline end up defending inflated numbers when the CFO asks for proof at month 6. Reviewing your customer engagement metrics alongside pipeline attribution gives a fuller picture of where agents are genuinely moving the needle.
What Are the Most Common Pitfalls That Kill Agentic GTM ROI Before Month 6?
The most common pitfalls are measuring adoption instead of outcomes, skipping the governance layer, and failing to redesign workflows before deploying agents. Each one independently can stall or eliminate measurable ROI within the first 6 months.
- Measuring usage, not outcomes: Login rates and "agent actions" satisfy no CFO. Tie every usage metric to a downstream business result from week 1.
- No workflow redesign: Agents layered onto broken processes amplify the breakage. Map current-state workflows before deployment and identify the 2-3 highest-friction steps agents will replace.
- Skipping the control group: Without a baseline comparison, you cannot prove causality. Even a small holdout cohort gives you defensible delta data.
- Ignoring data quality: Agents running on stale or inaccurate contact data produce low-quality outputs that damage reply rates and meeting conversion.
- No kill/scale gate: Define thresholds at day 45, 90, and 180. If metrics aren't hitting minimums, escalate or adjust before sunk costs accumulate.
Teams that avoided these pitfalls report results like the one from Predictable Revenue: "We reduced the complexity of three tools into one," consolidating their GTM tech stack while maintaining measurement clarity across the full sales cycle.
How Do Revenue Teams Build a CFO-Ready Agentic GTM ROI Report?
Revenue teams build a CFO-ready ROI report by structuring it around three questions: What did we invest? What did agents produce?
What did that production convert into? Each question maps to a section of the KPI ladder described above.
Your 6-month ROI report structure:
- Investment summary: Platform costs, implementation time, rep onboarding hours, governance setup.
- Throughput gains (months 0-4): Outreach volume, meetings booked, MQL-to-SQL conversion vs. baseline.
- Pipeline economics (months 4-6): Agent-sourced pipeline, CAC delta, cycle time compression, early win rate.
- Risk and governance score: Escalation rate, error rate, compliance incidents, data quality trend.
- Scale recommendation: Based on thresholds hit or missed at each stage gate.
This structure aligns with how sales productivity frameworks are evaluated at the executive level: investment in, measurable output out, business outcome documented. Apollo's unified GTM platform supports this model by keeping prospecting, engagement, pipeline tracking, and analytics in one workspace, eliminating the attribution gaps that fragmented tools create. As Census put it: "We cut our costs in half" by consolidating their stack.

Start Measuring Agentic GTM ROI With a Unified Platform
The first 6 months of agentic GTM ROI measurement come down to one discipline: connect every agent action to a business outcome before you report it. Build the KPI ladder before launch.
Instrument governance from week 0. Attribute pipeline with precision.
Set stage gates and honor them.
Teams that do this consistently move from pilot to scaled deployment with a CFO who is a champion, not a skeptic. Those that skip it join the percentage that get defunded before month 6.
Apollo gives RevOps leaders, SDRs, AEs, and revenue teams a single platform for prospecting, AI-powered outreach, pipeline tracking, and analytics, so your agentic GTM measurement starts from a clean, unified data foundation. Start free with Apollo and build your 6-month ROI scorecard from day one.
Prove Pipeline ROI Before Next Quarter
ROI pressure killing your tool budget? Apollo delivers measurable pipeline impact from day one — not months later. Nearly 100K paying customers have the numbers to back it up.
Schedule a Demo →Don't miss these
Sales
Inbound vs Outbound Marketing: Which Strategy Wins?
Sales
What Is a Sales Funnel? The Non-Linear Revenue Framework for 2026
Sales
What Is a Go-to-Market Strategy? The 2026 GTM Playbook
See Apollo in action
We'd love to show how Apollo can help you sell better.
By submitting this form, you will receive information, tips, and promotions from Apollo. To learn more, see our Privacy Statement.
4.7/5 based on 9,015 reviews
