
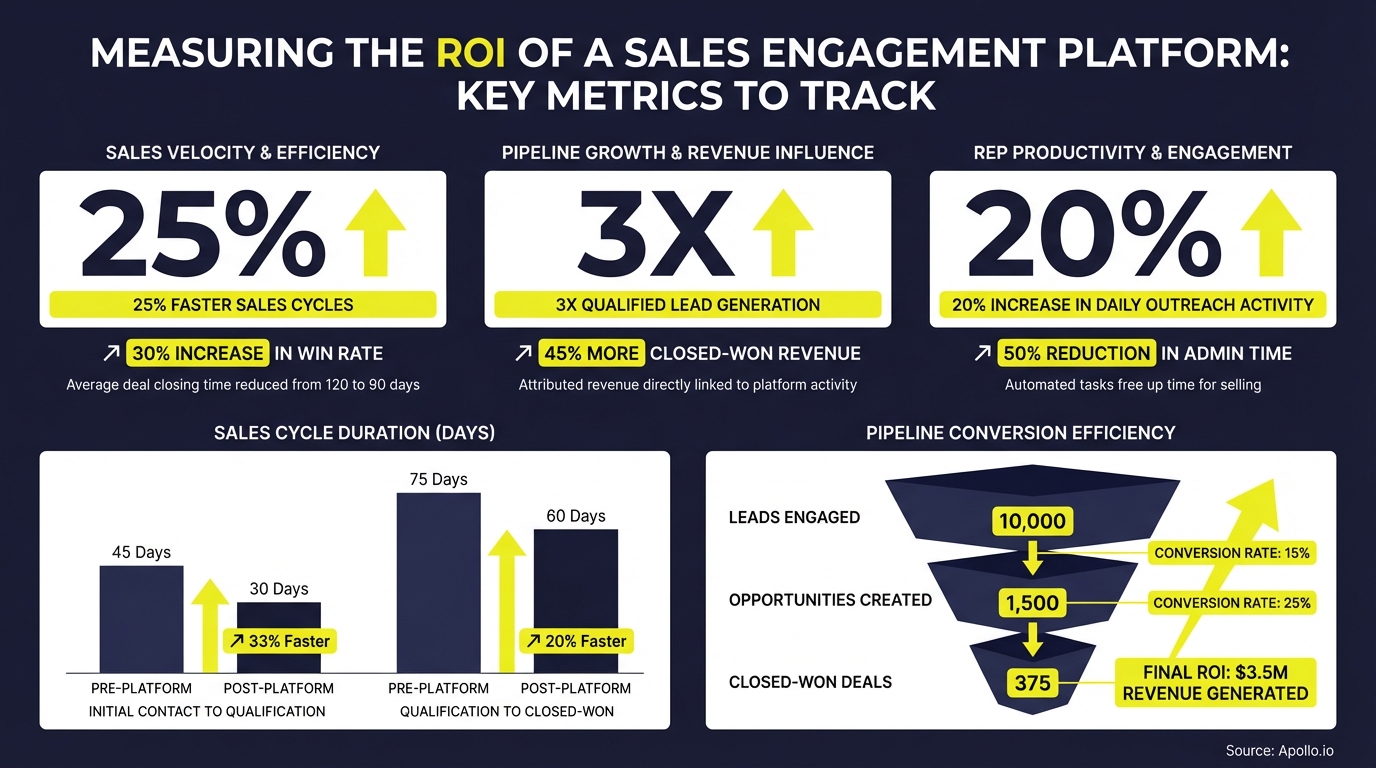
How to Measure the ROI of a Sales Engagement Platform
Most sales teams still report emails sent and calls made when their CFO asks about platform ROI. Those are activity metrics, not ROI metrics. To genuinely measure the return on a sales engagement platform, you need a metric chain that runs from outreach execution all the way to closed revenue and cost savings.
In 2026, finance teams are scrutinizing every line of the sales tech stack. Knowing exactly which numbers to pull, and how to translate them into dollars, is the difference between renewing confidently and losing budget in the next planning cycle.
Apollo Turns Hours of Research Into Minutes
Tired of your reps burning the day verifying contacts instead of closing deals? Apollo delivers 230M+ accurate business contacts so your team spends time selling, not searching. Start building pipeline faster today.
Start Free with Apollo →Key Takeaways
- ROI measurement requires a three-tier metric chain: engagement signals, pipeline outcomes, and profit impact.
- Win rate is the single most powerful metric for connecting platform adoption to revenue, calculated as closed-won deals divided by total opportunities.
- Stack-consolidation savings (retired licenses, reduced admin overhead) are a measurable ROI layer most teams undercount.
- Sales cycle length is a leading indicator of cost-of-sale efficiency: shorter cycles mean faster revenue recognition and lower CAC.
- A unified platform that combines prospecting, engagement, and analytics removes attribution gaps and makes ROI easier to prove.
What Is the ROI Framework for a Sales Engagement Platform?
The ROI framework for a sales engagement platform maps three tiers of metrics: engagement inputs, pipeline outputs, and financial outcomes. Tracking only one tier produces an incomplete picture that CFOs and revenue leaders will challenge.
| Tier | Metric Category | Example KPIs |
|---|---|---|
| Tier 1: Engagement | Activity quality and buyer response | Reply rate, meeting set rate, sequence completion rate |
| Tier 2: Pipeline | Opportunity creation and velocity | Opportunities created, stage conversion rate, sales cycle length |
| Tier 3: Profit | Revenue and cost impact | Win rate, average deal size, CAC, stack-consolidation savings |
Tying Tier 1 to Tier 3 is where most teams struggle. The practical bridge is a conversion chain: reply rate improvements drive more qualified meetings, which lift opportunity creation, which accelerates pipeline velocity, which ultimately improves win rate and revenue per rep. For a deeper look at the full KPI landscape, see what sales KPIs you should track in 2026.
Which Engagement Metrics Directly Predict Pipeline ROI?
Four engagement metrics have the strongest causal link to pipeline outcomes and should be your leading indicators.
- Reply rate by sequence: Measures prospect interest per outreach cadence. Low reply rates signal messaging or targeting problems before they become pipeline gaps. According to Kixie, monitoring this metric helps identify bottlenecks and optimize the sales process before they compound.
- Meeting set rate: The conversion from outreach to booked meeting. SDRs and BDRs should track this weekly to benchmark sequence performance and identify which channels (email, phone, social) drive the most qualified conversations.
- Sequence completion rate: Prospects who complete a full sequence are far more likely to convert than those who drop off mid-cadence. Low completion rates often indicate poor contact data quality or overly aggressive send cadences.
- Meaningful conversation rate: For phone-heavy teams, tracking the percentage of dials that result in a substantive conversation (not just a connection) separates raw call volume from actual engagement quality.
Spending hours on manual outreach and losing track of which sequences actually work? Automate your sequences with Apollo's multi-channel engagement platform and get per-sequence analytics built in.
What Are the Core Pipeline and Revenue Metrics to Track?
Pipeline and revenue metrics convert engagement activity into the financial language that CFOs and revenue leaders require for ROI sign-off.
- Win rate (opportunity-to-deal conversion): As Highspot notes, win rate measures sales effectiveness by dividing successfully closed deals by total opportunities identified. Even a modest lift in win rate, applied across your full pipeline, produces outsized revenue impact.
- Sales cycle length: Shorter cycles reduce the cost of sale and accelerate revenue recognition. Research from TryKondo confirms that longer cycles indicate higher costs of sale and slower revenue recognition, making cycle compression a direct profit lever.
- Average deal size: Track whether platform-assisted reps are closing larger deals through better pre-meeting intelligence, multi-threaded outreach, and timely follow-up. According to Persistence Market Research, average deal size reflects the typical value of closed deals and is a key indicator of platform impact on revenue quality.
- Pipeline coverage ratio: The multiple of pipeline versus quota. A healthy ratio means your engagement volume and quality are sufficient to meet revenue targets even with normal deal slippage.
- Stage conversion rates: Tracking conversion at each funnel stage reveals exactly where the platform is adding value and where prospects are stalling. For more on customer engagement metrics that actually work, see Apollo's breakdown.
Turn Funnel Guesswork Into Pipeline Wins
Pipeline forecasting a guessing game because leads stall before they ever reach your AEs? Apollo surfaces high-intent prospects and signals that actually convert. Nearly 100K paying customers stopped flying blind.
Schedule a Demo →How Do RevOps Leaders Calculate Stack-Consolidation ROI?
Stack-consolidation ROI measures the cost savings from retiring redundant tools when a unified platform replaces multiple point solutions. RevOps leaders should calculate this as a separate ROI line item alongside productivity gains.
The formula is straightforward: Consolidation ROI = (Annual license cost of retired tools) + (Admin hours saved × loaded hourly cost) + (Integration maintenance hours saved × loaded hourly cost). When teams consolidate prospecting data, sequencing, dialing, and analytics into one workspace, the license and integration overhead reduction is significant. Cyera put it directly: "Having everything in one system was a game changer." Census echoed this: "We cut our costs in half."
Beyond license savings, consolidation reduces the data-reconciliation work that plagues multi-tool stacks. Attribution becomes cleaner, adoption tracking is simpler, and RevOps spends less time maintaining integrations. For a broader look at KPIs, attribution, and marketing ROI, Apollo's insights hub covers the full picture.
Struggling to prove ROI across a fragmented tech stack? Explore Apollo's unified GTM platform and consolidate prospecting, engagement, and analytics into one workspace.

How Should SDRs and AEs Track ROI at the Rep Level?
SDRs and AEs should track rep-level productivity metrics that translate individual output into measurable pipeline contribution. The goal is a clear chain from daily activity to revenue impact.
For SDRs, the critical rep-level metrics are: meetings booked per week (versus pre-platform baseline), sequences active per rep, and reply-to-meeting conversion rate. These directly measure whether the platform is helping reps book more qualified conversations.
Tracking these against a pre-platform baseline is essential: without a baseline, you cannot isolate the platform's contribution from territory or market changes.
For Account Executives, the relevant metrics shift to: average days to close, deal value per opportunity, and follow-up sequence completion rate. AEs using structured sales productivity frameworks consistently report shorter cycles and better pipeline hygiene when engagement data is centralized. Managers should also track coaching time reclaimed: when sequence analytics surface which reps are underperforming and why, coaching becomes targeted rather than generic, which multiplies the platform's ROI across the entire team.
What Is the Right 90-Day ROI Measurement Cadence?
A 90-day measurement cadence gives teams enough time to establish baselines, drive adoption, and observe early pipeline signals without waiting a full quarter to course-correct.
- Days 1-30 (Baseline): Capture pre-platform benchmarks for reply rate, meeting set rate, sales cycle length, and win rate. Document current tool costs for consolidation comparison.
- Days 31-60 (Adoption): Track sequence adoption rate, login frequency, and data quality scores. Low adoption at this stage predicts weak ROI signals at 90 days and should trigger immediate enablement action.
- Days 61-90 (Early signals): Compare engagement metrics to baseline. Look for reply rate and meeting set rate improvements as leading indicators. Pipeline impact typically lags 30-60 days behind engagement improvements.
- Days 91-180 (Pipeline ROI): By month six, enough opportunities should have progressed to measure win rate lift, sales cycle compression, and pipeline coverage changes against the pre-platform baseline.
A structured sales analytics approach makes this cadence repeatable and defensible to finance stakeholders. Pair it with a one-page executive briefing that maps each metric to a dollar value for CFO-ready reporting.
How Do You Build a CFO-Ready ROI Report for a Sales Engagement Platform?
A CFO-ready ROI report translates platform metrics into three financial outcomes: revenue generated, cost avoided, and payback period. Each line item needs a formula, a baseline, and a current measurement.
| ROI Component | Formula | Data Source |
|---|---|---|
| Revenue lift from win-rate improvement | Win rate delta × opportunities × average deal size | CRM closed-won data |
| Capacity ROI from productivity gains | Hours saved per rep × loaded cost × team size | Platform activity logs vs. baseline |
| Stack-consolidation savings | Retired license costs + integration maintenance hours saved | Finance / IT records |
| CAC improvement | Total sales cost ÷ new customers (pre vs. post platform) | Finance + CRM |
The shift in 2026 is away from vanity activity metrics toward incremental pipeline and incremental revenue. CFOs want to see what would not have happened without the platform, not just what happened.
Using a holdout group (reps not yet on the platform) as a control is the most rigorous way to isolate lift and make your ROI case airtight.

Start Measuring What Actually Matters
Measuring the ROI of a sales engagement platform comes down to three disciplines: tracking the right metric tiers (engagement, pipeline, profit), establishing pre-platform baselines to isolate lift, and including stack-consolidation savings as a standalone ROI line item.
Teams that do all three can defend their platform investment in any budget review. Those still reporting emails sent will keep losing the conversation. Apollo unifies prospecting data, multi-channel sequencing, call intelligence, and analytics in one workspace, making every tier of this ROI framework measurable without stitching together multiple tools. As Predictable Revenue noted: "We reduced the complexity of three tools into one."
Ready to build a sales engagement stack you can actually measure? Try Apollo free and get the engagement, pipeline, and analytics data you need to prove ROI from day one.
Prove Pipeline ROI With Apollo
Budget approval stuck on unclear metrics? Apollo delivers measurable pipeline impact from day one — so you can justify every dollar spent. Nearly 100K paying customers closed the ROI gap fast.
Start Free with Apollo →Don't miss these
Sales
Inbound vs Outbound Marketing: Which Strategy Wins?
Sales
What Is a Sales Funnel? The Non-Linear Revenue Framework for 2026
Sales
What Is a Go-to-Market Strategy? The 2026 GTM Playbook
See Apollo in action
We'd love to show how Apollo can help you sell better.
By submitting this form, you will receive information, tips, and promotions from Apollo. To learn more, see our Privacy Statement.
4.7/5 based on 9,015 reviews
