
What Is Sales Volume? Definition, Calculation, and Why It Matters
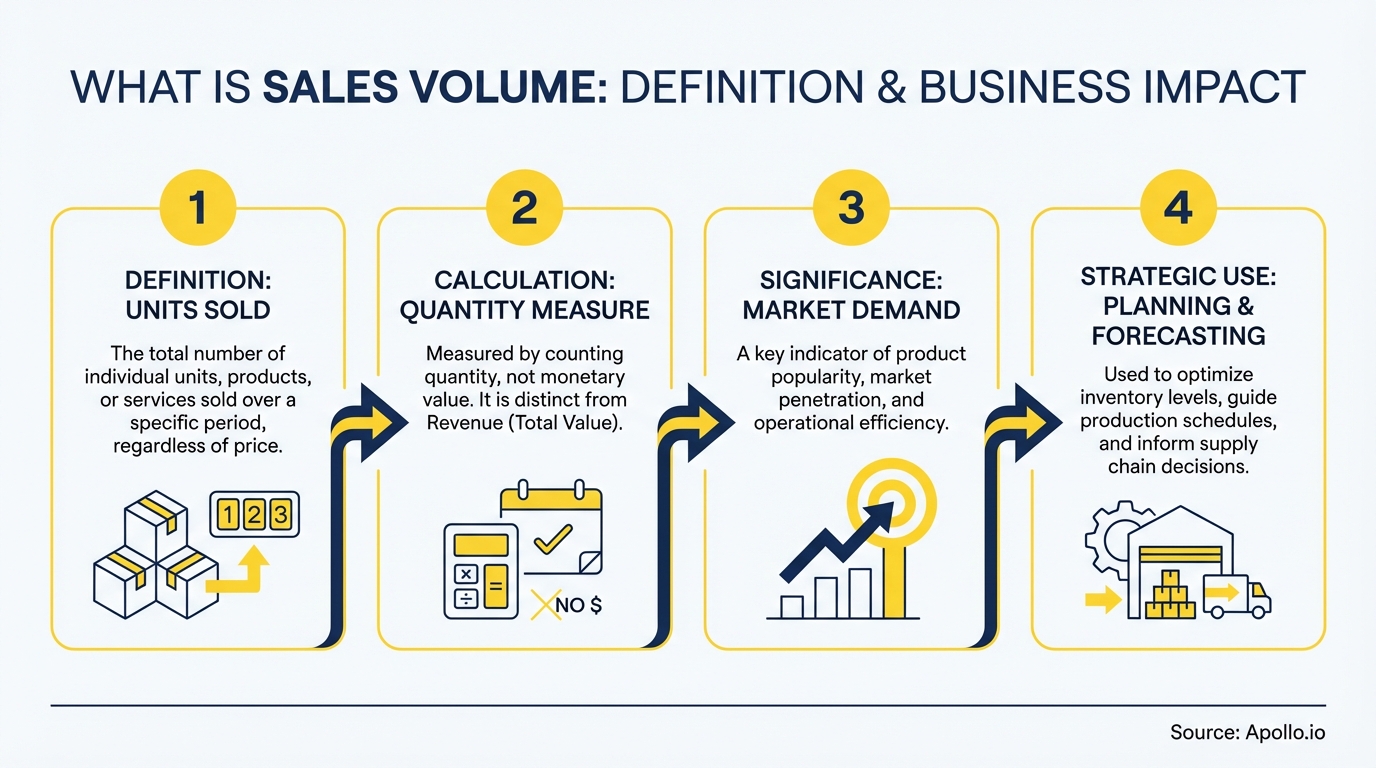
Sales volume measures the quantity of products or services sold during a specific time period. Unlike revenue (which reflects dollar value), sales volume tracks actual units moved, making it a critical indicator of market demand, operational efficiency, and business health. Sales analytics teams use volume metrics to spot trends early, optimize inventory, and forecast accurately in 2026's data-driven selling environment.
Understanding sales volume helps Sales Leaders and RevOps professionals answer critical questions: Are we gaining market share? Is our pricing strategy working? Should we scale production or adjust capacity? According to Digital Commerce 360, U.S. manufacturing and wholesale distribution sales reached $15.12 trillion in 2025, highlighting the massive scale at which volume tracking drives strategic decisions.
Apollo Finds Verified Contacts In Seconds
Tired of spending 4+ hours daily hunting for contact info? Apollo delivers 224M+ verified contacts with 96% email accuracy. Join 550K+ companies who eliminated manual research.
Start Free with Apollo →Key Takeaways
- Sales volume counts units sold, not dollars earned, making it the purest demand signal for product-market fit
- B2B teams track volume across multiple dimensions including bookings, shipments, renewals, and user activations
- RevOps leaders use volume metrics to identify channel performance gaps and optimize resource allocation
- Volume vs. revenue analysis reveals pricing power and helps Sales Leaders balance growth with profitability
- Real-time volume tracking in unified platforms prevents data inconsistencies that erode buyer trust
What Is Sales Volume?
Sales volume is the total number of units sold or transactions completed within a defined period. It differs fundamentally from sales revenue (total dollars) and sales value (monetary worth).
For a SaaS company, volume might mean new subscriptions, seat expansions, or module activations. For manufacturers, it tracks physical units shipped or produced.
The distinction matters because volume reveals customer adoption independent of pricing changes. If your revenue grows 20% but volume only grows 5%, you're relying on price increases rather than market expansion. Multiple factors affect sales volume including seasonality, competitive pressure, and economic conditions.
Research from Landbase shows the global B2B eCommerce market reached $32.11 trillion in 2025, demonstrating how digital channels have transformed volume measurement. Sales Leaders now track volume across web, mobile, partner, and direct channels simultaneously.
How Do Sales Leaders Calculate Sales Volume?
The basic formula is straightforward: Sales Volume = Total Units Sold during a specific time frame (day, week, month, quarter, year). However, B2B organizations track volume across multiple dimensions depending on their business model and key performance indicators.
| Business Model | Volume Metric | Calculation Example |
|---|---|---|
| SaaS Subscription | New Bookings | 150 new accounts signed in Q1 |
| Manufacturing | Units Shipped | 50,000 widgets delivered in March |
| Distribution | Order Volume | 2,400 orders processed this month |
| Professional Services | Projects Closed | 18 consulting engagements completed |
For Account Executives managing complex deals, volume calculations may include weighted pipeline stages, renewal rates, and expansion bookings. RevOps teams aggregate these metrics across CRM, billing, and fulfillment systems to create a single source of truth.
See Every Deal Stage In Real Time With Apollo
Forecasting feels like guesswork without live pipeline data. Apollo gives you instant visibility across every deal stage so you can predict revenue with confidence. Built-In increased win rates 10% with Apollo's signals.
Start Free with Apollo →Why Does Sales Volume Matter for B2B Teams?
Sales volume serves as an early warning system for business health. Revenue can temporarily mask problems through price increases or one-time deals, but declining volume signals fundamental market challenges.
Sales Leaders use volume trends to make critical decisions about hiring, territory design, and product investment.
Volume metrics drive operational planning across departments. Manufacturing scales production based on volume forecasts. Marketing allocates budget to channels that drive unit growth. Customer Success prioritizes accounts based on expansion volume potential. A study by Gradient Works found sales cycles lengthened by 32% from 2021 to 2022, making accurate volume forecasting more critical as deals take longer to close.
Struggling to track volume across disconnected systems? Unify your deal pipeline and get real-time volume visibility with Apollo.
What Are the Key Benefits of Tracking Sales Volume?
- Demand Forecasting: Volume trends predict future capacity needs before revenue signals catch up
- Pricing Strategy: Compare volume changes to revenue changes to measure price elasticity
- Channel Performance: Identify which sales channels drive actual customer acquisition vs. revenue concentration
- Inventory Optimization: Align production and procurement with actual demand signals
- Market Share Analysis: Benchmark your unit growth against industry volume trends
- Compensation Planning: Structure sales incentives around volume targets to drive customer base expansion
How Do SDRs and AEs Use Sales Volume Data?
SDRs use volume metrics to prioritize prospecting activities and qualify leads effectively. When volume targets emphasize new account acquisition, SDRs focus on top-of-funnel activities like cold outreach and B2B prospecting. When expansion volume matters more, they prioritize existing customer upsells and cross-sells.
Account Executives analyze volume patterns to identify buying signals and timing. If a customer's usage volume increases month-over-month, that signals expansion readiness.
If volume plateaus, it may indicate churn risk or competitive pressure. AEs also compare their individual volume performance against team benchmarks to identify coaching opportunities.
According to Passle, Gartner predicts 80% of B2B sales interactions will occur in digital channels by 2025. This shift means volume tracking must extend beyond closed deals to include digital touchpoints, content engagement, and self-service transactions.
What Is the Difference Between Sales Volume and Revenue?
Sales volume counts units or transactions. Revenue measures total dollars generated.
A company can increase revenue while volume declines (through price increases) or grow volume while revenue stays flat (through discounting). Understanding both metrics together reveals your true market position and pricing power.
| Metric | What It Measures | Strategic Signal |
|---|---|---|
| Sales Volume | Units sold, customers acquired, orders processed | Market demand, customer adoption, competitive position |
| Revenue | Total dollars generated from sales | Business scale, profitability potential, valuation |
| Average Deal Size | Revenue divided by volume | Pricing effectiveness, customer segment mix, deal quality |
Sales Leaders monitor the relationship between these metrics closely. If volume grows faster than revenue, you're likely competing on price. If revenue grows faster than volume, you're capturing more value per customer. Sales productivity frameworks use both metrics to optimize team performance and resource allocation.
How Can RevOps Teams Improve Sales Volume Tracking?
RevOps professionals face the challenge of aggregating volume data from multiple systems including CRM, billing platforms, product analytics, and fulfillment tools. Inconsistent definitions across these systems create reporting gaps that undermine decision-making and erode stakeholder trust.

Start by establishing a single definition of countable volume for your business model. Document what counts as a unit (new logo, seat, license, order, project) and create data governance rules for each source system.
Build automated dashboards that reconcile volume across systems daily rather than relying on monthly manual reporting.
Can't get clean volume data from your CRM? Enrich your pipeline with verified contact and company data from Apollo's 224M+ business contacts.
What Are Volume Tracking Best Practices?
- Standardize Definitions: Document exactly what constitutes a countable unit across all teams and systems
- Automate Data Capture: Eliminate manual entry that introduces errors and delays in volume reporting
- Segment by Cohort: Track new customer volume separately from expansion and renewal volume
- Monitor Leading Indicators: Connect volume metrics to earlier pipeline stages for predictive forecasting
- Reconcile Weekly: Compare volume across CRM, billing, and product systems to catch discrepancies early
- Align Incentives: Structure compensation plans that balance volume growth with deal quality and profitability
Conclusion
Sales volume measurement provides the clearest signal of market demand and customer adoption in 2026's digital-first B2B landscape. While revenue metrics matter for financial planning, volume trends reveal the underlying health of your customer acquisition engine and competitive position.
Sales Leaders, RevOps professionals, and Account Executives who master volume tracking gain predictive insights that drive better forecasting, resource allocation, and strategic decisions.
The shift toward rep-free buying experiences makes consistent, accessible volume data more critical than ever. Buyers expect accurate information across all channels, and inconsistent metrics erode trust.
Organizations that establish a single source of truth for volume definitions and automate cross-system reporting will outperform competitors still relying on manual reconciliation and siloed data.

Ready to consolidate your sales tech stack and get unified volume visibility? Start free with Apollo to track deals, enrich data, and manage your entire pipeline in one workspace.
Prove Apollo's ROI In Your First 30 Days
Budget approval stuck on unclear metrics? Apollo delivers measurable pipeline impact from day one—track time saved, meetings booked, and revenue generated. Built-In increased win rates 10% and ACV 10% with Apollo's signals.
Start Free with Apollo →Don't miss these
Sales
Inbound vs Outbound Marketing: Which Strategy Wins?
Sales
What Is a Sales Funnel? The Non-Linear Revenue Framework for 2026
Sales
What Is a Go-to-Market Strategy? The 2026 GTM Playbook
See Apollo in action
We'd love to show how Apollo can help you sell better.
By submitting this form, you will receive information, tips, and promotions from Apollo. To learn more, see our Privacy Statement.
4.7/5 based on 9,015 reviews
