
Sales Productivity Metrics That Actually Drive Revenue Growth
Sales teams face a harsh reality in 2026: Ebsta reports that an average of 69% of reps are falling short of quota. The culprit? Most organizations measure activity instead of outcomes. Sales productivity requires metrics that connect daily actions to revenue impact, not vanity numbers that mask underperformance.
The shift from "how many calls did we make?" to "how efficiently do we convert pipeline to revenue?" separates winning teams from those stuck in perpetual transformation. For SDRs, AEs, and sales leaders, the right metrics illuminate where time goes, which activities drive deals, and how to replicate top performer behaviors across the team.
Apollo Eliminates 4+ Hours Of Daily Research
Tired of spending 4+ hours daily hunting for contact info? Apollo delivers 224M verified contacts with 96% email accuracy. Join 550K+ companies closing deals faster.
Start Free with Apollo →Key Takeaways
- Sales productivity metrics must measure outcomes (pipeline velocity, win rates) not just activity (calls, emails) to identify real revenue drivers
- Reps spend only 28% of their week selling; time-in-motion metrics reveal where productivity leaks occur and how to reclaim hours
- AI-enabled platforms consolidate tools and automate non-selling tasks, creating measurable capacity gains without adding headcount
- Sales and marketing alignment metrics (MQL-to-SQL conversion, pipeline coverage) directly correlate with revenue performance
- Leading indicators (response rates, meeting-set rates) predict pipeline health weeks before lagging metrics show problems
What Are Sales Productivity Metrics?
Sales productivity metrics are quantifiable measures that track how efficiently your team converts time, effort, and resources into revenue outcomes. Unlike activity metrics that count outputs (emails sent, calls made), productivity metrics connect actions to business results: pipeline generated per rep, revenue per selling hour, or win rate by deal stage.
These metrics answer critical questions for sales leaders: Are reps spending time on high-value activities? Which behaviors correlate with closed deals?
Where do bottlenecks slow pipeline velocity? For RevOps teams, productivity metrics provide the diagnostic data needed to optimize processes, eliminate friction, and scale what works.
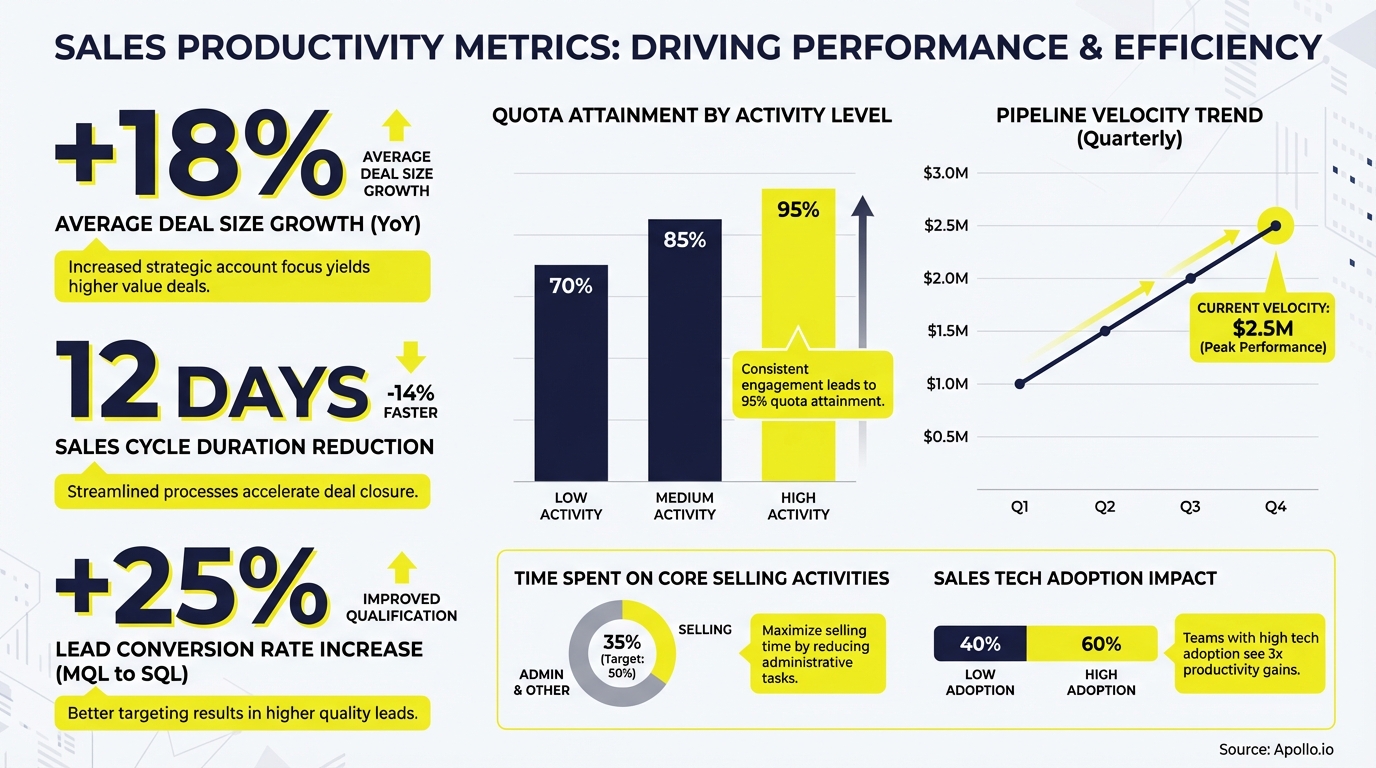
The distinction matters because Salesforce's State of Sales Report found reps spend only 28% of their week selling, a downward trend since 2018. Measuring productivity means identifying where the other 72% goes and reclaiming it for revenue-generating work.
Why Do Sales Productivity Metrics Matter in 2026?
The B2B selling environment has fundamentally changed. Buyers now prefer self-service research over rep interactions, sales cycles have lengthened, and quota attainment continues declining. According to Everstage, the average global quota attainment in Q4 2024 was 43%, indicating consistent underperformance across SaaS sales teams.
Traditional activity-based management fails in this environment. More calls don't equal more pipeline when buyers actively avoid irrelevant outreach.
More emails don't drive deals when personalization and timing determine response rates. Sales leaders need metrics that diagnose root causes: Is low quota attainment a volume problem, a conversion problem, or a deal quality problem?
Productivity metrics also reveal hidden capacity. If reps spend 72% of their time on non-selling activities, improving efficiency by even 10% creates the equivalent of hiring additional headcount without the cost.
For founders and CEOs managing tight budgets, productivity gains deliver immediate ROI.
How Have Buyer Behaviors Changed Productivity Requirements?
Buyers now control the sales process. They research independently, engage late in their journey, and expect reps to provide immediate value.
This shift demands new productivity metrics focused on conversion efficiency rather than activity volume. Measure response rates to initial outreach, meeting-set rates from discovery calls, and time-to-value in early interactions.
Sales and marketing alignment becomes measurable and mandatory. Research shows organizations with strong sales and marketing alignment achieve 208% higher marketing revenue than those with poor alignment. Track MQL-to-SQL conversion rates, pipeline coverage by segment, and revenue contribution by channel to ensure both teams optimize for the same outcomes.
What Core Metrics Should Sales Leaders Track?
Effective productivity measurement requires a balanced scorecard across leading indicators (predictive), operational efficiency (capacity), and lagging indicators (outcomes). Each category serves a specific purpose in diagnosing performance and prescribing improvements.
| Metric Category | Key Metrics | What It Reveals |
|---|---|---|
| Leading Indicators | Response rate, meeting-set rate, demo-to-trial conversion | Pipeline health 30-60 days ahead |
| Efficiency Metrics | Time spent selling, activities per hour, tool utilization | Where capacity leaks occur |
| Pipeline Metrics | Pipeline velocity, stage conversion rates, deal cycle length | Bottlenecks and conversion problems |
| Outcome Metrics | Quota attainment, win rate, revenue per rep | Ultimate performance and ROI |
For SDRs, focus on leading indicators: outreach-to-response rate, response-to-meeting rate, and meetings-set per day. These metrics predict pipeline generation before it shows up in CRM.
For AEs, track pipeline velocity (deal value × win rate ÷ sales cycle length) and win rate by stage to identify where deals stall or fall out.
Struggling to track these metrics across fragmented tools? Consolidate your sales stack with Apollo's unified platform for pipeline visibility.
See Every Deal In Real-Time With Apollo
Pipeline forecasting a guessing game? Apollo gives you live visibility into every deal stage while surfacing ready-to-buy accounts. Built-In increased win rates 10% with Apollo's scoring and signals.
Start Free with Apollo →How Do Sales Leaders Measure Time-in-Motion Productivity?
Time-in-motion analysis reveals where reps actually spend their hours: selling activities (calls, meetings, demos) versus non-selling work (data entry, research, admin tasks). The 28% selling-time benchmark means 72% of capacity goes to supporting activities, many of which can be automated or eliminated.
Start by categorizing activities into selling time, enablement time (training, coaching), and administrative time (CRM updates, reporting, scheduling). Measure each category weekly to establish baselines.
Then identify high-impact automation opportunities: automatic data capture eliminates manual CRM entry, AI-powered research reduces prospecting prep time, and sequence automation handles follow-up cadences.
Calculate time saved per automation and multiply by team size to quantify capacity gains. If automating meeting scheduling saves each rep 30 minutes daily, a 10-person team reclaims 50 hours weekly for selling activities.
That's the equivalent of adding 1.25 full-time reps without hiring.
What Tools Help Track Selling Time Versus Admin Time?
Modern sales platforms automatically capture activity data and categorize time allocation. Look for systems that track logged calls, meetings held, emails sent, and CRM updates without manual input. Sales analytics platforms then visualize how reps spend their hours and compare top performers to the team average.
For RevOps leaders, this data identifies process inefficiencies and tool friction. If reps spend 10 hours weekly on manual data enrichment, that's a clear signal to invest in automated enrichment.
If scheduling meetings consumes 5 hours per rep, calendar automation delivers immediate ROI.

How Do SDRs Use Productivity Metrics to Book More Meetings?
SDRs need metrics that connect daily activities to meeting outcomes. The most actionable are conversion rates at each funnel stage: accounts researched → accounts contacted → responses received → meetings booked.
These ratios reveal exactly where productivity breaks down.
Top-performing SDRs typically achieve 20-30% response rates and convert 30-40% of responses to meetings. If your response rate is 10%, the problem is message relevance or targeting, not activity volume.
If you get responses but don't convert to meetings, your qualification or value proposition needs work.
Track these metrics daily and weekly to identify patterns. Which accounts respond best?
What messaging drives engagement? Which follow-up sequences convert?
Use this data to replicate what works and eliminate what doesn't. SDRs using data-driven iteration consistently outperform those running the same plays regardless of results.
Spending hours researching prospects manually? Search Apollo's 224M+ contacts with 65+ filters to find qualified leads in minutes.
What Sales and Marketing Alignment Metrics Drive Revenue?
Sales and marketing misalignment costs organizations measurable revenue. Research from LXA Hub shows B2B companies' inability to align sales and marketing teams around effective processes and technologies costs 10% or more of revenue per year.
The solution is shared accountability through joint metrics: MQL-to-SQL conversion rate (marketing quality), SQL-to-opportunity conversion rate (sales qualification), pipeline coverage by segment (joint planning), and revenue contribution by channel (attribution). When both teams optimize for the same outcomes, productivity improves across the entire funnel.
Implement weekly pipeline reviews where marketing and sales jointly analyze conversion rates, identify bottlenecks, and adjust targeting or messaging. This operational cadence ensures alignment isn't just a goal but a measured, managed process. Learn which B2B marketing metrics actually drive revenue growth.
How Should Sales Leaders Implement a Productivity Metrics Framework?
Start with baseline measurement across three categories: leading indicators (response rates, meeting-set rates), efficiency metrics (selling time, activity per hour), and outcome metrics (quota attainment, win rates). Establish benchmarks for your team and industry, then identify the biggest gaps.
Prioritize quick wins that deliver immediate capacity gains: automate CRM data entry, implement meeting scheduling tools, create email templates for common scenarios.
Measure time saved and reinvest it in selling activities.
Track how these changes impact leading indicators within 30 days.
For longer-term improvements, analyze top-performer behaviors and systematize them. If your top 20% achieve 40% response rates while the team averages 15%, document their targeting criteria, messaging, and follow-up cadences.
Build playbooks that enable the entire team to replicate top-performer productivity.
What Quick Wins Deliver Immediate Productivity Gains?
- Automate data entry: Eliminate manual CRM updates with tools that capture emails, calls, and meeting notes automatically
- Standardize research: Create saved searches and filters for ideal customer profiles to reduce prospecting time
- Template common communications: Build libraries for intro emails, follow-ups, and objection responses
- Schedule in batches: Block specific hours for prospecting, calls, and admin work to reduce context-switching
- Measure and iterate: Review weekly metrics to identify what's working and double down on high-ROI activities
Start Measuring What Matters for Revenue Growth
Sales productivity metrics transform how teams operate by connecting daily activities to revenue outcomes. The shift from measuring activity to measuring efficiency reveals where time goes, which behaviors drive results, and how to replicate top-performer success across the entire organization.
For SDRs, track conversion rates at each funnel stage. For AEs, measure pipeline velocity and win rates.
For sales leaders, implement time-in-motion analysis to reclaim capacity. For RevOps teams, establish sales and marketing alignment metrics that drive joint accountability.
Each role benefits from specific, actionable metrics that diagnose problems and prescribe solutions.
The organizations winning in 2026 measure productivity through the lens of efficiency-to-outcome, not raw activity. They automate non-selling tasks, eliminate tool friction, and optimize for behaviors that convert pipeline to revenue. Ready to consolidate your sales tech stack and boost team productivity? Start prospecting with Apollo's all-in-one platform.
Prove Apollo's ROI In Your First 30 Days
Budget approval stuck on unclear metrics? Apollo tracks every dollar spent to pipeline generated—with real-time dashboards showing exactly how you hit quota. Built-In increased win rates 10% and ACV 10% using Apollo's signals.
Start Free with Apollo →Don't miss these
Sales
Inbound vs Outbound Marketing: Which Strategy Wins?
Sales
What Is a Sales Funnel? The Non-Linear Revenue Framework for 2026
Sales
What Is a Go-to-Market Strategy? The 2026 GTM Playbook
See Apollo in action
We'd love to show how Apollo can help you sell better.
By submitting this form, you will receive information, tips, and promotions from Apollo. To learn more, see our Privacy Statement.
4.7/5 based on 9,015 reviews
