
What Are B2B Marketing Metrics and How Do They Drive Growth?
B2B marketing metrics are quantifiable measures that track the performance and effectiveness of your marketing activities. They reveal what's working, what's not, and where to invest your budget for maximum return. According to McKinsey research, B2B companies effectively using commercial analytics are 1.5 times more likely to achieve above-average growth rates and can see up to five percentage points higher return on sales compared to peers.
Yet Forrester reports that 64% of B2B marketing leaders don't trust their organization's marketing measurement for decision-making. This disconnect costs companies millions in wasted spend and missed opportunities.
Apollo Finds Contacts In Seconds, Not Hours
Tired of spending 4+ hours daily hunting for contact info? Apollo delivers 224M verified contacts with 96% email accuracy. Join 550K+ companies who stopped manual research.
Start Free with Apollo →Key Takeaways
- Companies using analytics effectively are 1.5x more likely to achieve above-average growth rates
- 66% of B2B marketers prioritize data quality as their top improvement area for 2026
- Marketing and sales alignment issues prevent 44% of B2B marketers from reaching their goals
- E-commerce now accounts for 34% of B2B revenue, surpassing in-person sales channels
- Focus on metrics that directly connect marketing activity to revenue outcomes
Why Most B2B Marketing Metrics Fail
The problem isn't tracking too few metrics—it's tracking the wrong ones. Most marketing teams drown in vanity metrics like page views and social media likes while struggling to connect their work to revenue.
Three core issues plague B2B marketing measurement:
- Misalignment with business objectives: 61% of marketing leaders say their analytics don't map to organizational goals
- Data quality problems: Dirty data produces unreliable insights that erode trust in analytics
- Marketing-sales disconnect: 44% of marketers cite alignment issues as the primary barrier to hitting targets
"Apollo enriches everything we have: contacts, leads, accounts... And we don't really have to touch it, it just works."
The solution? Focus on metrics that demonstrate clear cause-and-effect relationships between marketing activities and revenue outcomes. Need better data quality? Apollo's data enrichment automatically maintains 96% email accuracy across 224M+ contacts.
What Are the Essential B2B Marketing Metrics?
The metrics that matter fall into three categories: revenue impact, pipeline health, and channel performance. Here's what to track:

Revenue-Connected Metrics
| Metric | What It Measures | Why It Matters |
|---|---|---|
| Marketing-Sourced Revenue | Revenue from marketing-generated opportunities | Proves marketing's direct contribution to the bottom line |
| Customer Acquisition Cost (CAC) | Total cost to acquire one customer | Determines profitability and scalability of growth |
| Marketing ROI | Revenue generated per dollar spent | Justifies budget allocation and program investment |
| Customer Lifetime Value (CLV) | Total revenue from a customer relationship | Informs acquisition spend limits and retention priorities |
Pipeline Health Metrics
| Metric | What It Measures | Why It Matters |
|---|---|---|
| Marketing Qualified Leads (MQLs) | Leads meeting engagement thresholds | Tracks top-of-funnel effectiveness and lead quality |
| Sales Qualified Leads (SQLs) | Leads accepted by sales as viable opportunities | Measures marketing-sales alignment and lead quality |
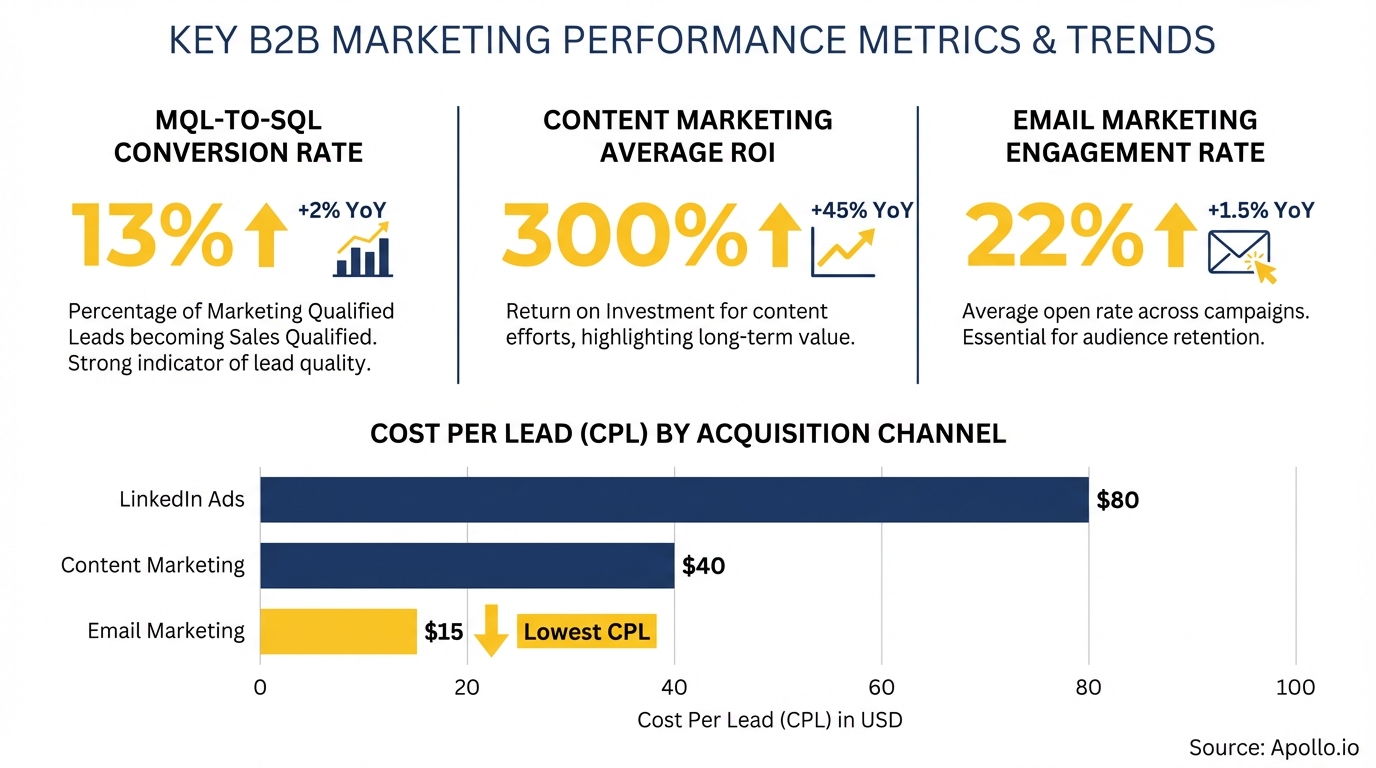
| MQL-to-SQL Conversion Rate | Percentage of MQLs advancing to sales stages | Reveals lead qualification accuracy |
| Opportunity-to-Close Rate | Percentage of opportunities that become customers | Indicates deal quality and sales effectiveness |
Struggling to qualify leads fast enough? Search Apollo's 224M+ contacts with 65+ filters to find and prioritize your ideal prospects in minutes.
Channel Performance Metrics
Different channels require different measurement approaches. Focus on metrics that reveal actual business impact:
- Content Marketing: Organic traffic, keyword rankings, content-influenced pipeline, time to conversion
- Email Marketing: Open rates (industry average: 15-25%), click-through rates, email-sourced opportunities, unsubscribe rates
- Paid Advertising: Cost per lead, cost per opportunity, ROAS (return on ad spend), conversion rates by channel
- Social Media: Engagement rate, social-sourced leads, influence on deal velocity, executive engagement
Learn more about optimizing your channels in our guide to B2B digital marketing strategy.
Turn Forecast Guesswork Into Revenue Certainty
Pipeline forecasting a guessing game? Apollo's real-time deal intelligence gives you accurate visibility across every stage. Built-In increased win rates 10% with Apollo's scoring and signals.
Start Free with Apollo →How Do You Build a Metrics Framework That Works?
A functional metrics framework connects daily activities to quarterly revenue goals. Here's how to build one:
Step 1: Map Metrics to Business Objectives
Start with revenue targets, then work backward. If your goal is $10M in new revenue and your average deal size is $50K, you need 200 closed deals.
If your close rate is 20%, you need 1,000 qualified opportunities. This math drives your entire measurement framework.
Step 2: Establish Data Governance
Dirty data destroys trust in analytics. Set clear standards:
- Define lead stages and qualification criteria with sales
- Implement automated data enrichment (manual updates don't scale)
- Create SLAs for lead follow-up and status updates
- Audit data quality monthly and fix gaps immediately
"We benchmarked ZoomInfo versus Apollo, Clearbit, Lusha, and Seamless, and ultimately Apollo won on all fronts, especially in enrichment. Higher quality than ZoomInfo, greater breadth than Clearbit."
Step 3: Align Marketing and Sales on Metrics
Marketing and sales must agree on definitions, targets, and handoff processes. Create shared dashboards showing:
- Pipeline coverage by quarter (target: 3-5x quota)
- Lead velocity (rate of new opportunity creation)
- Conversion rates at each funnel stage
- Win rates by lead source and campaign
For more on alignment strategies, see our guide on marketing metrics that actually matter.
Step 4: Implement Attribution Modeling
Attribution reveals which touchpoints influence deals. Three models work for most B2B companies:

| Model | Best For | Limitation |
|---|---|---|
| First-Touch | Measuring demand generation effectiveness | Ignores nurturing and later-stage influence |
| Last-Touch | Measuring sales enablement and conversion | Ignores awareness and consideration stages |
| Multi-Touch | Understanding full customer journey | Complex to implement and interpret |
Start simple with first-touch and last-touch, then layer in multi-touch as your analytics mature.
What Metrics Matter for Digital-First B2B Sales?
E-commerce now drives 34% of B2B revenue, surpassing in-person sales. This shift demands new metrics:
- Digital engagement score: Tracks website activity, content downloads, and product page views
- Self-service conversion rate: Percentage of visitors who complete transactions without sales contact
- Digital-influenced pipeline: Opportunities where digital touchpoints played a role
- Online-to-offline conversion: Website visitors who become sales conversations
With 80% of B2B sales interactions now occurring in digital channels, your metrics must reflect how buyers actually research and purchase. Read more in our B2B buyer journey guide.
How Do You Measure Marketing-Sales Alignment?
Marketing-sales misalignment costs companies an average of 10% of revenue annually. Track these alignment metrics:
| Metric | Target | What It Reveals |
|---|---|---|
| Lead acceptance rate | >75% | Whether sales trusts marketing's lead quality |
| Average time to first contact | <24 hours | Sales responsiveness to marketing-generated leads |
| Lead recycling rate | <10% | How often leads get passed back to marketing |
| Joint pipeline reviews | Weekly | Frequency of collaborative pipeline planning |
Implement weekly pipeline reviews where marketing and sales analyze conversion rates, discuss lead quality, and adjust targeting together. This single practice resolves most alignment issues.
What Are the Biggest Mistakes in B2B Marketing Measurement?
Avoid these common pitfalls that undermine analytics effectiveness:
Tracking too many metrics. More dashboards don't equal better decisions. Focus on 8-12 core metrics that directly connect to revenue. Everything else is noise.
Ignoring data quality. 66% of B2B marketers now prioritize data quality improvements. Garbage in, garbage out. If your data is unreliable, your insights are worthless.
Measuring activities instead of outcomes. Emails sent, ads clicked, and content downloaded don't matter if they don't generate pipeline. Connect every metric to a revenue outcome.
Setting metrics without context. A 2% conversion rate could be excellent or terrible depending on your industry, deal size, and sales cycle. Benchmark against your own historical performance and industry standards.
Creating separate marketing and sales metrics. When marketing and sales optimize for different numbers, you get internal competition instead of customer focus.
Share goals, share metrics, share success.
Start Tracking Metrics That Actually Matter
The difference between good and great B2B marketing isn't creativity or budget—it's measurement. Companies that master marketing analytics grow 1.5x faster than peers because they know exactly what works and double down on it.
Start with these three steps:
- Audit your current metrics against the revenue-connected framework above
- Implement data governance to ensure reliable analytics
- Align marketing and sales on shared definitions and targets
The tools matter too. Apollo consolidates prospecting, engagement, and data enrichment into one workspace, eliminating the tool sprawl that makes measurement impossible.
With 224M+ verified contacts, 96% email accuracy, and built-in analytics, you get clean data and clear insights without juggling multiple platforms.
Ready to transform your marketing measurement? Start prospecting with Apollo for free and see how unified data drives better decisions.
Turn Tool Spend Into Measurable Pipeline Growth
Budget approval stuck on unclear metrics? Apollo tracks every dollar to pipeline impact with built-in attribution. Built-In increased win rates 10% and ACV 10% using Apollo's ROI dashboard.
Start Free with Apollo →Don't miss these
Sales
Inbound vs Outbound Marketing: Which Strategy Wins?
Sales
What Is a Sales Funnel? The Non-Linear Revenue Framework for 2026
Sales
What Is a Go-to-Market Strategy? The 2026 GTM Playbook
See Apollo in action
We'd love to show how Apollo can help you sell better.
By submitting this form, you will receive information, tips, and promotions from Apollo. To learn more, see our Privacy Statement.
4.7/5 based on 9,015 reviews
