
What Are Projected Sales? Methods, Formulas, and Tools for 2026
Projected sales are forward-looking revenue estimates that help GTM teams plan headcount, set quotas, allocate budget, and prioritize pipeline activity. Without reliable projections, sales leaders make decisions based on gut feel rather than data, and sales analytics never gets connected to actual business outcomes. Getting projections right is now more urgent: according to SalesGlobe, global GDP growth is expected to slow to 2.9% in 2025 and 2.8% in 2026, compressing margin for error in revenue planning.
Apollo Turns Research Hours Into Pipeline
Tired of your reps burning the day on manual research instead of selling? Apollo surfaces verified contacts instantly, so your team spends time closing, not digging. Nearly 100K paying customers scaled pipeline without scaling headcount.
Start Free with Apollo →Key Takeaways
- Projected sales are estimates of future revenue based on historical data, pipeline activity, and market conditions.
- The most reliable projections combine multiple methods: historical trend analysis, pipeline-weighted forecasting, and market sizing.
- RevOps teams that build mature forecasting processes are 1.4x more likely to exceed revenue goals by at least 10%.
- Buyers now complete nearly two-thirds of their journey before contacting a vendor, making early pipeline data critical for accurate projections.
- Apollo consolidates the data, pipeline, and engagement signals you need to produce and act on projections from a single platform.
What Are Projected Sales?
Projected sales (also called a sales forecast or revenue projection) are data-driven estimates of how much revenue a business expects to generate over a defined period. They differ from sales targets, which are aspirational goals set by leadership.
Projections are grounded in evidence: historical performance, current pipeline coverage, win rates, average deal size, and external market signals.
Projections serve three core functions:
- Resource planning: Hiring, capacity, and budget decisions all depend on expected revenue.
- Pipeline management: Knowing where you stand vs. projection tells you how aggressively to source new opportunities.
- Investor and executive reporting: Board-level confidence depends on credible, defensible numbers.
What Are the Core Methods for Calculating Projected Sales?
There is no single formula that works for every business. The best approach combines two or more of these methods to triangulate a reliable number.
| Method | How It Works | Best For |
|---|---|---|
| Historical Trend Analysis | Apply average growth rate to prior-period revenue | Established businesses with consistent data |
| Pipeline-Weighted Forecast | Multiply deal value by stage-based close probability | Teams with structured CRM data |
| Bottom-Up Modeling | Sum rep-level quotas and activity metrics | Growing teams building outbound from scratch |
| Market-Sizing (Top-Down) | Estimate TAM and apply realistic capture rate | New markets or product launches |
| Opportunity Stage Forecasting | Assign revenue probability by deal stage | AEs managing complex, multi-stakeholder deals |
A practical starting formula for pipeline-weighted projections: Projected Revenue = Open Pipeline Value × Average Win Rate × (1 - Average Slip Rate). Layer in historical seasonality adjustments and you have a working model.

Why Do Projected Sales Matter More in 2026?
Buyer behavior has shifted the timing and nature of sales engagement. Research from marketingltb.com shows only 17% of the B2B buying process now involves direct interaction with sales representatives, down from 22% in 2023. Buyers self-educate first and engage vendors later, which means your pipeline data reflects a narrower, later slice of buyer intent than it once did.
This has two direct effects on projections:
- Deals that enter your pipeline are often further along in the buyer's evaluation, compressing your visible sales cycle.
- Early-stage pipeline signals (content engagement, intent data, inbound activity) become more predictive inputs for accurate projections.
Meanwhile, dbswebsite.com reports that content marketing is projected to generate $107 billion in revenue by 2026, up from $82.3 billion in 2024, underscoring that the channels feeding your top-of-funnel pipeline carry real revenue weight. Ignoring channel mix in your projections means leaving signal on the table.
Struggling to build a pipeline that gives you enough data for reliable projections? Build and manage your sales pipeline with Apollo's AI-powered pipeline builder.

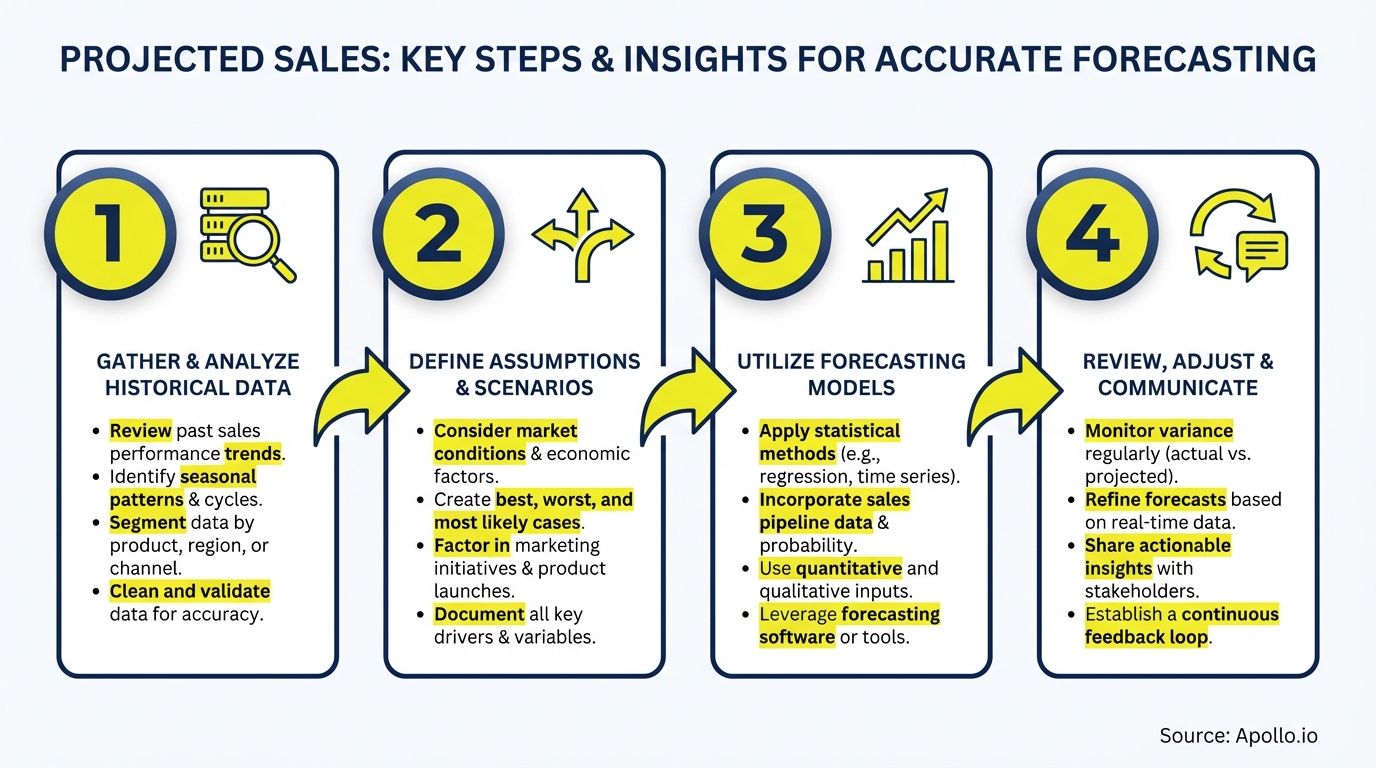
How Do RevOps Leaders Build More Accurate Projections?
RevOps owns forecast accuracy. The gap between good and great forecasting teams often comes down to data hygiene, process consistency, and tooling, not the sophistication of the model itself. According to thethunderclap.com, organizations with mature revenue operations were 1.4 times more likely to exceed revenue goals by at least 10% compared to those without.
Key practices RevOps leaders use to sharpen projected sales:
- Define stage exit criteria clearly. Vague pipeline stages produce vague forecasts. Each stage needs objective criteria for deal advancement.
- Track leading indicators. Monitor activities (meetings booked, proposals sent, multi-threading rate) alongside lagging revenue metrics. See which sales KPIs to track in 2026 for a complete framework.
- Run rolling 90-day forecasts. Static annual projections go stale. Weekly cadence updates keep numbers current.
- Segment by rep, segment, and channel. Aggregate forecasts hide variance. Granular breakdowns reveal where confidence is high and where coverage is thin.
- Build a revenue operations framework that connects pipeline data to forecast outputs automatically.
Apollo Turns Funnel Gaps Into Forecast Wins
Pipeline forecasting a guessing game? Apollo surfaces verified, in-market buyers so your funnel fills with leads that actually convert. Top revenue teams trust Apollo to make every forecast count.
Schedule a Demo →How Can SDRs and AEs Improve the Data Behind Projections?
Projected sales are only as good as the pipeline data feeding them. SDRs and AEs directly control the quality and completeness of that data through how they log activity, qualify opportunities, and update deal records.
For SDRs: Accurate projected sales start with accurate prospecting. When SDRs work from verified contact data and log every outreach touchpoint, RevOps gets reliable top-of-funnel velocity metrics, which are essential inputs for any projection model. Using AI sales tools to automate activity logging removes the manual burden and improves data completeness.
For AEs: Deal-level accuracy matters most at the bottom of the funnel. AEs managing complex opportunities should update deal stage, close date, and risk flags consistently. Deal management software centralizes this activity and surfaces stale deals before they distort your forecast.
Want to give your SDRs better prospecting data so your pipeline projections reflect real opportunity? Search Apollo's 230M+ verified contacts with 65+ filters to build pipeline that converts.
What Common Mistakes Distort Projected Sales?
Even teams with solid models produce bad projections. The usual culprits:
- Optimism bias: Reps systematically overestimate close probability on deals they own. Build in historical win rate adjustments by rep and segment.
- Stale pipeline: Deals that haven't moved in 30+ days inflate projected revenue without reflecting real opportunity. Regular sales productivity reviews help flush stale pipeline.
- Ignoring churn and contraction: Net revenue projections must account for downgrades and churn in existing accounts, not just new business.
- Single-method dependency: Relying solely on rep-submitted forecasts without triangulating against pipeline coverage ratios or historical trends introduces unnecessary error.
- No sensitivity analysis: Projections presented without a range (base case, upside, downside) mislead executives and boards about actual confidence levels.
How Does Apollo Help Teams Build and Hit Projected Sales?
Apollo is an all-in-one GTM platform that consolidates the tools most teams use to build, manage, and convert pipeline. Instead of stitching together separate platforms for prospecting, engagement, and pipeline tracking, teams like Predictable Revenue use Apollo as a single workspace: "We reduced the complexity of three tools into one."
For projected sales specifically, Apollo contributes at every stage of the projection loop:
- Data quality: 97% email accuracy and 230M+ verified contacts mean your pipeline inputs are reliable, not inflated by bounced leads.
- Pipeline visibility: Deal management and sales analytics give RevOps a real-time view of coverage vs. target.
- Engagement signals: Multi-channel sequence data surfaces which deals are active and which are going cold, improving forecast accuracy.
- AI automation: Apollo's sales automation tools reduce manual data entry, so pipeline records stay current without rep overhead.
Conclusion: Turn Projected Sales Into a Competitive Advantage
Projected sales are not just a reporting exercise. They are the operating system for how your revenue team allocates effort, sets expectations, and builds toward targets.
In a market where buyers self-educate before engaging sellers and GDP growth is slowing, the teams that project accurately and act on those projections faster will outperform those that guess.
The foundation is clean pipeline data, consistent process, and tools that connect prospecting activity to revenue outcomes in one place. Apollo gives GTM teams exactly that, without the cost and complexity of a fragmented tech stack.
As Census put it: "We cut our costs in half."
Ready to build pipeline you can actually project from? Start Free with Apollo and connect your prospecting, engagement, and pipeline data in one unified platform.
Prove Pipeline ROI With Apollo
Budget approval stuck on unclear metrics? Apollo delivers measurable pipeline impact your leadership can't ignore. Leadium 3x'd their revenue — see your ROI before you commit.
Schedule a Demo →Don't miss these
Sales
Inbound vs Outbound Marketing: Which Strategy Wins?
Sales
What Is a Sales Funnel? The Non-Linear Revenue Framework for 2026
Sales
What Is a Go-to-Market Strategy? The 2026 GTM Playbook
See Apollo in action
We'd love to show how Apollo can help you sell better.
By submitting this form, you will receive information, tips, and promotions from Apollo. To learn more, see our Privacy Statement.
4.7/5 based on 9,015 reviews
