
How to Build a Sales Performance Dashboard That Drives Revenue Growth
Sales teams in 2026 face a critical challenge: too much data, too many tools, and not enough actionable insights. Research by Gartner shows that 60% of B2B sales organizations have transitioned to data-driven selling, integrating sales processes, applications, and analytics into unified operations. A sales performance dashboard transforms scattered metrics into clear direction for sales leaders, SDRs, and AEs who need real-time visibility into pipeline health, team productivity, and revenue forecasts.
Apollo Eliminates 4+ Hours Of Daily Research
Tired of spending 4+ hours daily hunting for contact info? Apollo delivers 224M verified contacts with 96% email accuracy instantly. Join 550K+ companies who turned research time into selling time.
Start Free with Apollo →Key Takeaways
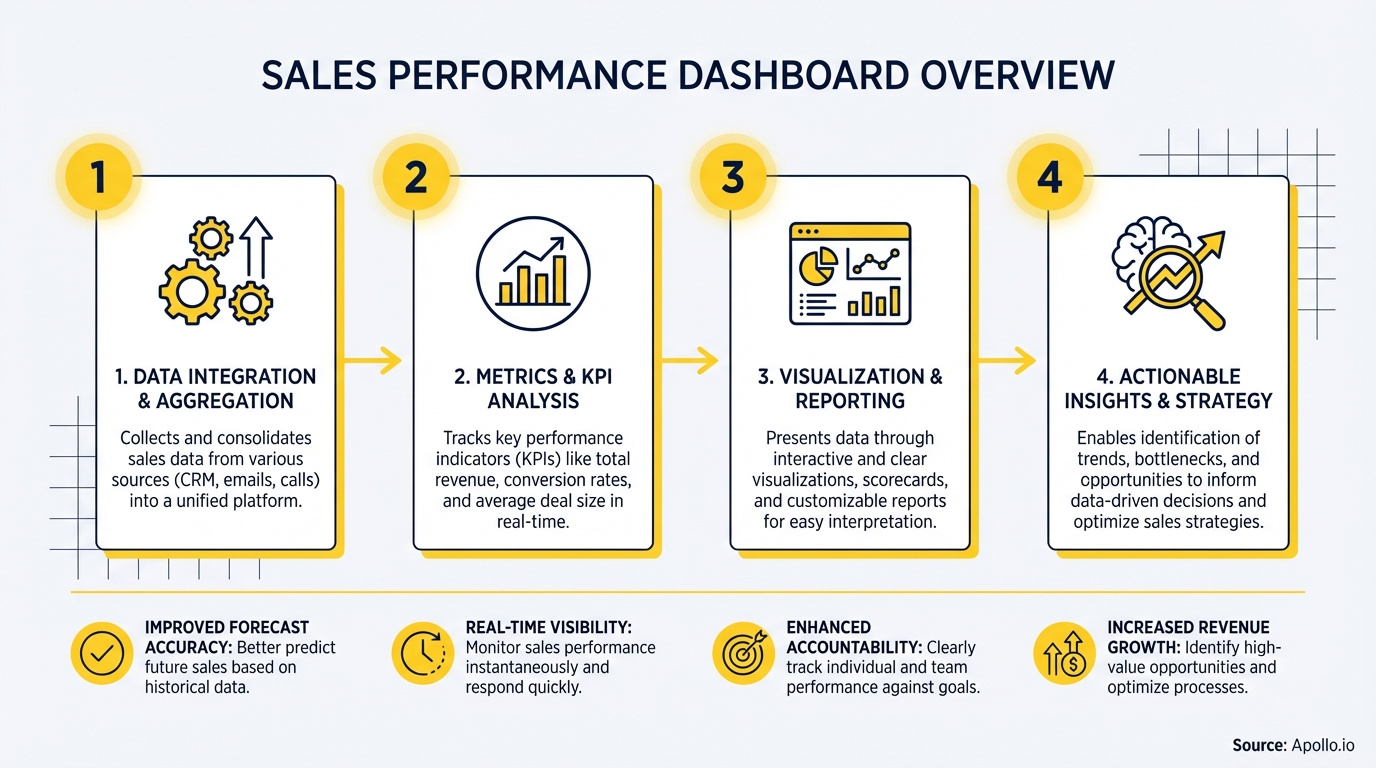
- Sales performance dashboards consolidate data from multiple sources into one real-time view of pipeline, quota attainment, and team activity
- RevOps teams use dashboards to identify bottlenecks, coach underperformers, and forecast revenue with accuracy
- Modern dashboards balance AI-driven insights with human judgment, helping AEs prioritize high-value deals and SDRs focus on quality outreach
- Effective dashboards track 5-8 core KPIs rather than overwhelming users with dozens of vanity metrics
- Tool consolidation cuts costs and improves data accuracy when dashboards integrate with your entire GTM stack
What Is a Sales Performance Dashboard?
A sales performance dashboard is a real-time visual interface that aggregates key metrics from your CRM, engagement platforms, and revenue systems into one unified view. It tracks pipeline velocity, quota attainment, activity metrics, and deal health across your entire sales organization.
Sales Leaders use dashboards to identify which reps need coaching, which deals are at risk, and whether the team will hit quarterly targets. RevOps teams rely on dashboards to spot data quality issues, process bottlenecks, and sales performance management opportunities before they impact revenue.
The best dashboards in 2026 combine historical data with predictive analytics, showing not just what happened but what's likely to happen next. This shift from descriptive to prescriptive insights helps teams act proactively rather than react to problems after they've already cost you deals.
Why Do Sales Teams Need Performance Dashboards in 2026?
According to McKinsey, hybrid sales models combining in-person, remote, and digital interactions now drive up to 50% more revenue through broader customer engagement. This complexity makes manual tracking impossible.
Modern sales teams operate across multiple channels:

- Email sequences and cold outreach campaigns
- Phone calls and video meetings
- Social selling and digital touchpoints
- In-person events and field sales
Without a centralized dashboard, Sales Leaders can't see which channels drive results, which reps need support, or where deals stall. Dashboards eliminate blind spots and replace guesswork with data-backed decisions.

Struggling to track performance across multiple tools? Consolidate your entire sales workflow with Apollo's unified platform.
See Every Deal Stage In Real Time With Apollo
Forecasting a guessing game without real-time pipeline visibility. Apollo delivers instant deal stage tracking across your entire team. Built-In boosted win rates 10% with Apollo's scoring.
Start Free with Apollo →What Metrics Should Sales Leaders Track on Dashboards?
The most effective dashboards track 5-8 core metrics that directly impact revenue. More metrics create noise, not clarity. Focus on KPIs that drive coaching conversations and strategic decisions.
| Metric Category | Key KPIs | Why It Matters |
|---|---|---|
| Pipeline Health | Pipeline coverage ratio, weighted pipeline value, stage conversion rates | Predicts whether you'll hit revenue targets 60-90 days out |
| Activity Metrics | Outreach volume, connect rates, meetings booked | Shows SDR productivity and identifies coaching opportunities |
| Deal Velocity | Average sales cycle length, time in stage, deal slippage rate | Reveals bottlenecks and helps AEs prioritize closing activities |
| Quota Attainment | Individual and team quota progress, forecast vs. actual | Enables proactive coaching before reps fall behind |
| Win/Loss Analysis | Win rate by segment, loss reasons, competitive displacement | Informs product positioning and sales strategy |
RevOps teams should monitor data quality metrics alongside performance KPIs. Track incomplete records, duplicate contacts, and stale data that undermine forecast accuracy and sales analytics reliability.
How Do Sales Leaders Use Dashboards to Coach Teams?
Sales Leaders use dashboards to identify performance gaps before they become problems. Instead of waiting for monthly reviews, managers spot trends in real-time and intervene with targeted coaching.
Effective coaching workflows powered by dashboards:
- Activity coaching for SDRs: Compare outreach volume and connect rates across the team to identify top performers and laggards
- Pipeline coaching for AEs: Review deal health scores and time-in-stage metrics to prioritize which opportunities need attention
- Skill development: Track win rates by rep and deal type to uncover training needs
- Forecast accuracy: Compare rep forecasts to actual outcomes to improve prediction discipline
Apollo's data-driven coaching platform surfaces these insights automatically, helping managers spend less time pulling reports and more time developing their teams. "Having everything in one system was a game changer," says a Sales Leader at Cyera.
How Should RevOps Teams Implement Sales Dashboards?
RevOps teams face a critical decision: build custom dashboards or adopt an integrated platform. Custom builds offer flexibility but require ongoing maintenance, technical resources, and complex integrations across your sales tech stack.
Implementation roadmap for RevOps:
- Audit data sources: Identify all systems feeding dashboard metrics (CRM, engagement platforms, conversation intelligence, etc.)
- Define core KPIs: Align Sales Leaders on the 5-8 metrics that matter most
- Establish data governance: Set standards for data entry, field definitions, and update frequency
- Build role-based views: Create different dashboards for SDRs, AEs, managers, and executives
- Train and iterate: Launch with your most data-savvy team, gather feedback, refine before rolling out broadly
Tool consolidation dramatically simplifies this process. "We reduced the complexity of three tools into one," reports a RevOps leader at Predictable Revenue. Unified platforms eliminate integration headaches and improve data accuracy.
Tired of stitching together multiple sales tools? Apollo's all-in-one GTM platform combines prospecting, engagement, and analytics in one workspace.
What Role Does AI Play in Modern Sales Dashboards?
AI transforms dashboards from backward-looking reports into forward-looking decision engines. Machine learning models analyze historical patterns to predict deal outcomes, identify at-risk opportunities, and recommend next-best actions for reps.
AI-powered dashboard capabilities in 2026:
- Deal scoring: Algorithms evaluate deal health based on engagement signals, stakeholder involvement, and historical win patterns
- Churn prediction: Early warning systems flag accounts showing disengagement before they churn
- Activity recommendations: AI suggests which prospects SDRs should prioritize and what message approach to use
- Forecast refinement: Models adjust rep forecasts based on actual close rates and deal characteristics
However, research shows that 75% of B2B buyers will prefer sales experiences prioritizing human interaction over AI by 2030. The best dashboards balance AI insights with human judgment, using automation to surface opportunities while leaving relationship decisions to experienced sellers.
AEs report that AI sales tools help them focus on high-value activities rather than administrative busywork. Apollo's AI Research Agent drives 46% more meetings by automating prospect research while maintaining the personal touch buyers expect.
Start Building Your Sales Performance Dashboard
Sales performance dashboards are no longer optional in 2026. With hybrid selling models, complex buyer journeys, and distributed teams, leaders need real-time visibility into what's working and where teams need support.
The most effective dashboards balance comprehensive data with focused insights, track leading indicators alongside lagging metrics, and combine AI-powered predictions with human expertise. RevOps teams that consolidate their tech stack report significant cost savings and improved data quality. "We cut our costs in half," says a RevOps director at Census.
For Sales Leaders, the question isn't whether to implement dashboards but how quickly you can move from reactive reporting to proactive coaching. Start with your core KPIs, ensure clean data inputs, and build dashboards that drive action rather than just display information.
Ready to transform scattered data into revenue growth? Start a Trial with Apollo's unified sales platform and see how consolidating your entire GTM workflow accelerates pipeline velocity and quota attainment.
Prove Apollo's ROI In Your First 30 Days
Budget approval stuck on unclear metrics? Apollo tracks pipeline impact from day one—quantifiable time savings, win rate lifts, and deal velocity. Built-In increased win rates 10% and ACV 10% with Apollo's scoring.
Start Free with Apollo →Don't miss these
Sales
Inbound vs Outbound Marketing: Which Strategy Wins?
Sales
What Is a Sales Funnel? The Non-Linear Revenue Framework for 2026
Sales
What Is a Go-to-Market Strategy? The 2026 GTM Playbook
See Apollo in action
We'd love to show how Apollo can help you sell better.
By submitting this form, you will receive information, tips, and promotions from Apollo. To learn more, see our Privacy Statement.
4.7/5 based on 9,015 reviews
