
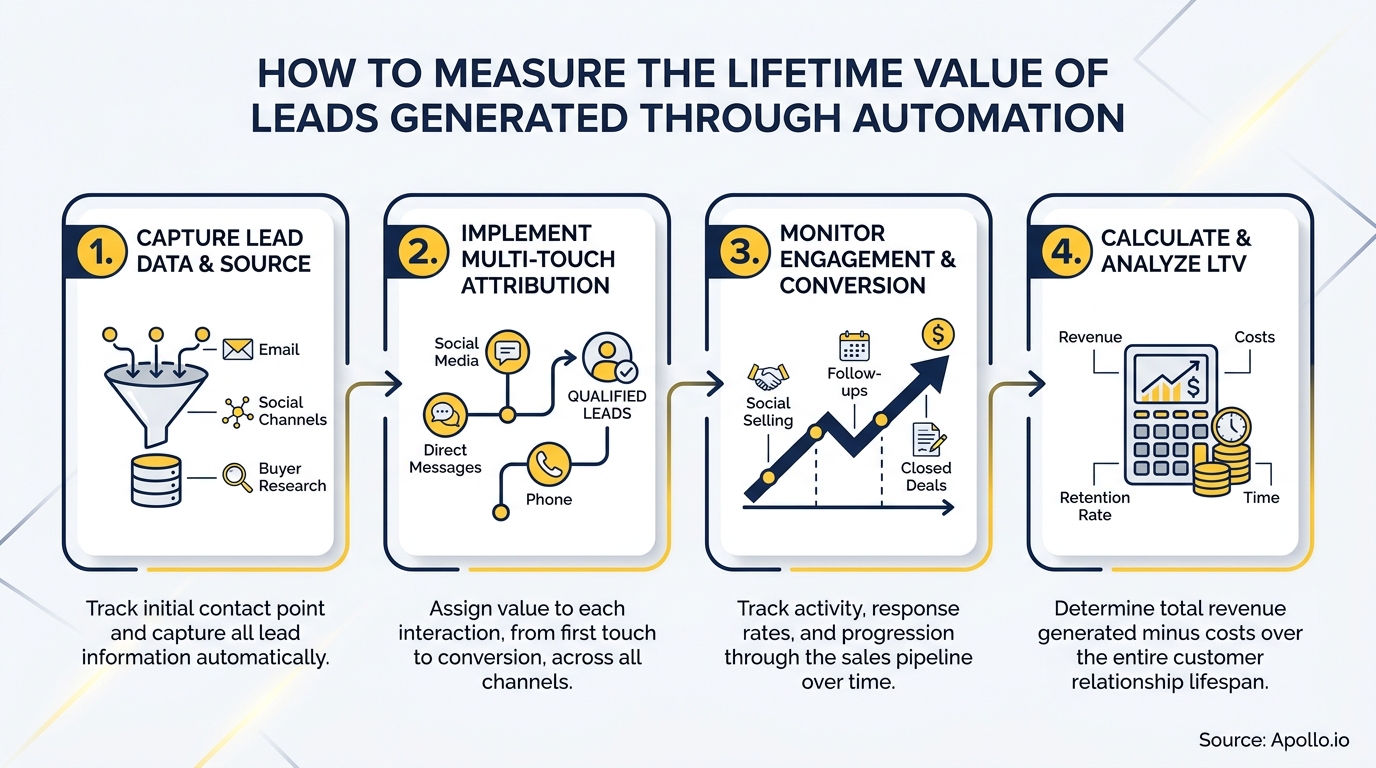
How to Measure the Lifetime Value of Leads Generated Through Automation in 2026
Your automated lead gen is booking meetings and filling the funnel. But are those leads actually worth what you think they are?
Most B2B teams measure automation success by lead volume or first-sale revenue, missing the metric that actually matters: discounted, post-acquisition lifetime value by lead source. This guide gives RevOps leaders, marketing teams, and sales professionals a closed-loop, cohort-based method to compute automation lead LTV, including expansion, churn, and a quality guardrail to protect retention.
If you are still building your automated lead generation foundation, start with how to build an automated lead generation system before applying the LTV framework below.
Scale Smarter With Apollo's AI Engine
Tired of hours lost to manual research and leads that go nowhere? Apollo surfaces verified contacts and automates outreach so your team spends time selling, not searching. Join 600K+ companies building predictable pipeline.
Start Free with Apollo →Key Takeaways
- Automation lead LTV is the net present value of post-acquisition profit by lead source, not lead count or first-sale revenue.
- Most teams measure the wrong layer: lead volume and conversion dominate dashboards, while LTV:CAC and retention remain underused.
- A healthy LTV:CAC ratio benchmark for B2B SaaS is approximately 3:1, making it the single most actionable ratio to track per automation channel.
- Closed-loop measurement requires joining your marketing automation platform (MAP), CRM, and finance data into one cohort view per lead source.
- Automation quality directly impacts downstream LTV: irrelevant outreach erodes retention even when it lifts short-term response rates.
Why Does Automation Lead LTV Matter More Than Lead Volume?
Automation lead LTV matters because volume-based metrics hide unprofitable acquisition. A high-volume automated channel can produce low-margin, high-churn customers that destroy revenue over a 24-month horizon, while a lower-volume channel with strong fit customers generates compounding expansion revenue.
According to research on CLV statistics, while 89% of companies agree that CLV and a great customer experience are crucial for driving brand loyalty, only 42% are able to measure CLV accurately. That gap is where budget gets misallocated.
The Forrester January 2026 State of Business Buyingreport adds another layer: a typical B2B buying decision now involves 13 internal stakeholders and 9 external influencers. That means individual MQLs from automated channels are insufficient units of measurement. LTV must be assessed at the account and buying-group level, not as isolated form fills.
What Data Do You Need to Calculate Automation Lead LTV?
Calculating automation lead LTV requires joining four data sources: your marketing automation platform (MAP), CRM, product or billing system, and finance or accounting data. Without this join, you cannot connect first-touch automation source to renewal, expansion, and gross margin.
| Input | Data Source | Why It Matters |
|---|---|---|
| Lead source / first automation touch | MAP (e.g., sequence, workflow, campaign) | Defines the cohort for attribution |
| Acquisition cost (CAC) | Finance + CRM (sales hours, tool cost) | Sets the LTV:CAC denominator |
| Gross margin per account | Billing / finance system | Converts revenue to profit-adjusted LTV |
| Monthly/annual churn rate | CRM / customer success platform | Determines average customer lifespan |
| Expansion / upsell revenue | CRM / billing system | Captures full account value over time |
| Discount rate (WACC or hurdle rate) | Finance | Converts future cash flows to present value |
Salesforce's 2026 State of Marketing found that 84% of marketers still run generic campaigns and 69% struggle to respond promptly because they lack usable context. Teams with unified customer data are significantly more likely to use AI agents effectively.
If your CRM, service, and finance data are siloed, you cannot close the attribution loop from automated lead to renewal or churn.
Struggling to find and qualify leads whose data actually flows cleanly into your CRM? Search Apollo's 230M+ verified contacts with 65+ filters to build lead cohorts with the enriched data fields your LTV model requires.

How Do You Calculate Automation Lead LTV Using a Cohort Model?
Calculate automation lead LTV by grouping all customers acquired through the same automated source into a cohort, then computing the net present value (NPV) of their gross-margin-adjusted cash flows over their observed or projected lifespan.
The Core LTV Formula
LTV = (Average Revenue Per Account × Gross Margin %) ÷ Churn Rate
For a finance-grade, discounted version:
LTV (NPV) = Σ [ (Gross Margin in Period t) ÷ (1 + Discount Rate)^t ] summed across the cohort's average lifespan.
As a worked example: a B2B deal size of $5,000 with twice-yearly purchases and a 5-year customer relationship produces an LTV of $50,000, as noted by The Insight Collective. Apply your gross margin percentage (e.g., 70%) and you arrive at a profit-adjusted LTV of $35,000 per customer from that cohort.
The LTV:CAC Ratio as Your Benchmark
Once you have LTV per automation cohort, divide by the CAC for that channel. According to HubiFi's B2B SaaS benchmarks, many investors and operators use an LTV:CAC ratio of around 3:1 as a healthy starting benchmark for sustainable growth. Cohorts below 3:1 are candidates for optimization or reallocation; cohorts above 3:1 justify increased investment.
Turn Funnel Gaps Into Closed Revenue
Tired of watching marketing leads stall before they ever reach your pipeline? Apollo surfaces high-intent prospects and arms your team with the intelligence to act first. Nearly 100K paying customers stopped guessing and started closing.
Start Free with Apollo →What KPIs Should RevOps Track on an Automation LTV Dashboard?
RevOps leaders should track five KPIs per automation cohort: LTV, LTV:CAC ratio, payback period, expansion revenue rate, and churn rate. This set distinguishes high-volume-but-low-quality channels from lower-volume channels that compound value over time.
| KPI | Formula / Definition | Healthy Signal |
|---|---|---|
| Automation Lead LTV | NPV of gross-margin cash flows by cohort | Growing quarter-over-quarter per cohort |
| LTV:CAC | LTV ÷ CAC per automation source | ≥ 3:1 |
| Payback Period | CAC ÷ Monthly Gross Margin per Account | < 12 months for SMB, < 18 for enterprise |
| Expansion Revenue Rate | Upsell + cross-sell ÷ Starting ARR | > 20% Net Revenue Retention signal |
| Cohort Churn Rate | Churned accounts ÷ Starting cohort size | Declining trend per automation source |
For SDRs and BDRs using sales automation, connecting sequence-level data to CRM outcome fields enables your RevOps team to assign each closed-won deal back to the originating automation touch, closing the attribution loop at the source level.
How Does Automation Quality Affect Lead LTV?
Automation quality directly depresses lead LTV when outreach is irrelevant or inconsistent with your product's actual value proposition. High response rates from poorly targeted sequences may inflate pipeline metrics while producing customers who churn early or never expand.
A Gartner 2025 survey of 632 B2B buyers found that 73% actively avoid suppliers that send irrelevant outreach, and 69% see inconsistencies between website and sales-rep information. Both behaviors signal post-sale misalignment that reduces retention and expansion revenue, the two largest drivers of LTV.
Use these quality gates before attributing a lead cohort's LTV to an automation channel:
- Relevance check: Does the automated message match the prospect's actual role, industry, and stage? Intent data improves targeting precision and reduces irrelevant outreach.
- Consistency check: Does messaging align with what sales reps say on calls and what your website promises?
- Fit check: Are closed-won customers from this cohort renewing and expanding at rates comparable to other channels?
- A/B test cadence: Run controlled tests on sequence variants and compare 12-month cohort LTV, not just reply rates.
Spending hours managing outreach that generates volume but not verified pipeline quality? Apollo's AI sales automation combines verified contact data with multi-channel sequences so your automation cohorts start with higher-fit leads, directly improving downstream LTV.
How Can Marketing Leaders and AEs Use LTV Data to Prioritize Automation Investment?
Marketing leaders and Account Executives can use per-cohort LTV:CAC ratios to reallocate budget from high-volume, low-LTV automation channels toward lower-volume channels producing customers with stronger retention and expansion revenue.
Research from Martal shows that companies excelling at lead nurturing generate 50% more sales-ready leads at 33% lower cost. That cost efficiency only compounds when those nurtured leads produce higher-LTV customers. For AEs, understanding which automated sequences sourced their closed-won accounts helps them replicate the qualification signals that predict strong retention.
For marketing leaders, the practical workflow is:
- Tag every lead at the automation source level in your MAP and CRM.
- Pull 6- and 12-month cohort LTV by source monthly.
- Compare LTV:CAC across channels and shift budget toward cohorts at or above the 3:1 benchmark.
- Use prospect nurturing strategies to improve fit and message consistency for underperforming cohorts before cutting them entirely.

Start Measuring Automation Lead LTV Today
The teams pulling ahead in 2026 are not the ones with the most automated leads. They are the ones who can trace each automated motion to margin-adjusted lifetime value, account-level retention, and an LTV:CAC ratio that justifies continued investment.
The framework is straightforward: join your MAP, CRM, and finance data into source-level cohorts, apply the gross-margin-adjusted LTV formula, benchmark against a 3:1 LTV:CAC target, and use quality gates to protect downstream retention. From there, Apollo's workflow automation and sales automation software give your team the enriched data and sequence-level attribution needed to run this model at scale.
Ready to build automation cohorts that actually compound in value? Start Prospecting with Apollo and connect verified lead data directly to your LTV measurement workflow.
Prove Pipeline ROI With Apollo
ROI pressure killing your tool budget? Apollo gives sales teams measurable wins fast — 46% more meetings, trackable pipeline impact, clear numbers for every stakeholder. Nearly 100K paying customers already justified the spend.
Start Free with Apollo →Don't miss these
Sales
Inbound vs Outbound Marketing: Which Strategy Wins?
Sales
What Is a Sales Funnel? The Non-Linear Revenue Framework for 2026
Sales
What Is a Go-to-Market Strategy? The 2026 GTM Playbook
See Apollo in action
We'd love to show how Apollo can help you sell better.
By submitting this form, you will receive information, tips, and promotions from Apollo. To learn more, see our Privacy Statement.
4.7/5 based on 9,015 reviews
