
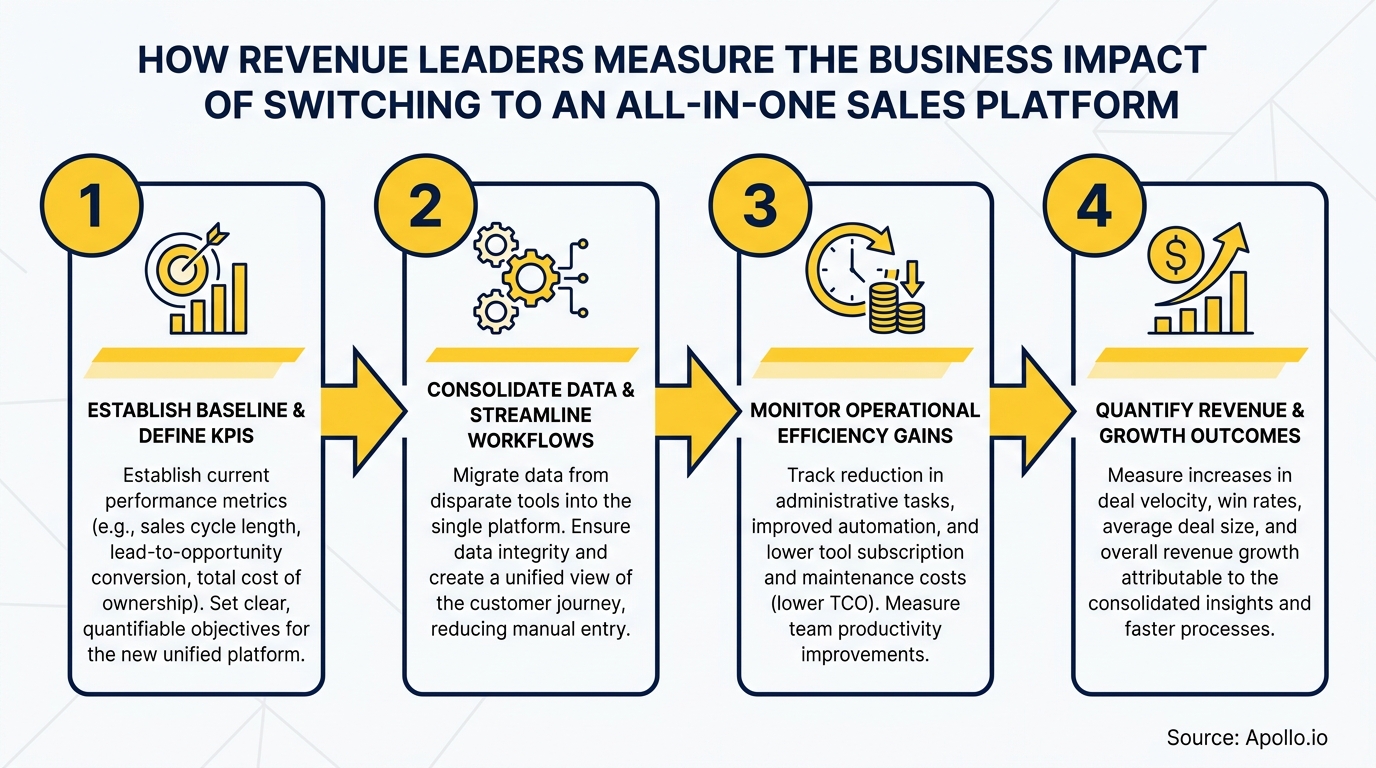
How Do Revenue Leaders Measure the Business Impact of Switching to an All-in-One Sales Platform?
CFOs and CROs are no longer satisfied with "hours saved" as a ROI story. In 2026, the expectation is clear: prove incremental revenue lift, not just efficiency gains. Yet a Bain survey of 1,200+ senior commercial executives found that only roughly 20% of companies have realized full value from their revenue technology investments, primarily because integration remains the gating factor. Revenue leaders who switch to an all-in-one sales platform need a structured measurement framework, not just a feature checklist. Understanding how sales analytics drives revenue growth is the starting point for building that case.
Research Less, Close More With Apollo
Tired of burning hours verifying emails and chasing dead-end contacts? Apollo delivers 97% email accuracy so your team sells instead of searches. Over 600K companies already stopped the manual grind.
Start Free with Apollo →Key Takeaways
- Most companies fail to realize full platform value because integration, not features, is what drives ROI.
- Revenue leaders should track leading indicators (tool adoption, data quality, automation rates) before expecting lagging outcomes like win rate or cycle time.
- Cross-channel data consistency is now a measurable buyer-experience metric, not just an internal IT concern.
- AI readiness depends on consolidated, clean data, making tech-stack consolidation an AI strategy, not just a cost play.
- The strongest consolidation business cases combine revenue outcomes with cost-to-serve reductions across the full GTM lifecycle.
What Is the Integration-to-Value Gap and Why Does It Matter?
The integration-to-value gap is the distance between deploying a unified sales platform and actually realizing its revenue impact. Most teams close the deployment gap quickly but stall on the integration side: workflows remain siloed, data stays fragmented, and reps revert to old habits.
Research from TryKondo's B2B Sales Report shows 90% to 94% of sales organizations planned to consolidate their tech stack specifically to reduce context switching and improve data access. The intent is there. The execution gap is where value leaks out.
Revenue leaders should baseline these metrics before migration, then track them at 30, 60, and 90 days post-launch:
- CRM data completeness rate (% of records with full contact, company, and activity data)
- Workflow automation rate (% of outreach steps executed automatically vs. manually)
- Cross-team handoff SLA compliance (marketing-to-sales, sales-to-success)
- Duplicate record rate and data freshness score
What KPIs Belong on a Revenue Impact Scorecard?
A revenue impact scorecard tracks both leading indicators (predictors) and lagging outcomes (results), giving finance and the CEO a complete picture of platform ROI. Relying only on lagging metrics like closed-won revenue makes it impossible to course-correct during the first 90 days.
| Category | Leading Indicator | Lagging Outcome |
|---|---|---|
| Pipeline Health | Pipeline coverage ratio, stage velocity | Pipeline conversion rate, closed revenue |
| Outreach Quality | Sequence completion rate, reply rate | Meeting booked rate, win rate |
| Data Governance | Contact enrichment %, duplicate rate | Bounce rate, deliverability score |
| Buyer Experience | Message consistency score, outreach relevance | Deal cycle time, expansion rate |
| Cost Efficiency | Tool count, license spend per rep | CAC, cost-to-serve per customer |
Buyer experience metrics deserve special attention. Gartner's survey of 632 B2B buyers (conducted August–September 2024, reported June 2025) found 69% experienced inconsistencies between supplier website information and what sellers actually communicated. Platform consolidation directly reduces that inconsistency by giving every rep access to the same enriched data and approved messaging. Tracking cross-channel message consistency before and after migration is a concrete way to show buyer-experience improvement. For a deeper look at building this kind of measurement infrastructure, see the sales acceleration formula.
Struggling to build pipeline visibility across fragmented tools? See how Apollo unifies pipeline tracking in one workspace.
Turn Funnel Gaps Into Pipeline Wins
Pipeline forecasting a guessing game because quality leads never convert? Apollo surfaces in-market buyers with precision targeting so your team stops chasing cold leads and starts closing real opportunities. Nearly 100K paying customers already know the difference.
Schedule a Demo →How Do RevOps Leaders Use Adoption as a Leading Indicator?
Tool adoption rate is one of the strongest predictors of revenue growth outperformance after a platform switch. McKinsey's analysis of B2B commercial teams found that outperformers were significantly more likely to rate themselves effective at using digital tools to support sales (62% vs. 39% for slow growers).
RevOps leaders should monitor adoption weekly in the first quarter post-migration. Key signals include:
- Active users / licensed seats: Low ratios signal change management failure, not platform failure.
- Sequence enrollment rate: Are SDRs actually using automated sequences, or defaulting to one-off emails?
- AI feature utilization: Are AEs using AI-generated messaging suggestions, research summaries, or call intelligence?
- Play compliance rate: What percentage of reps are following the defined GTM plays inside the platform?
Data from GetProspectX illustrates the adoption problem clearly: B2B companies use an average of 87 different software tools, yet only 23% of those tools directly impact revenue generation. Consolidating to fewer, higher-adoption tools is itself a measurable business outcome. Consolidation also frees RevOps from managing integrations and gives them time to focus on improving sales productivity at the team level.

Why Does AI Readiness Depend on Platform Consolidation?
AI-powered GTM workflows require clean, unified, accessible data. Fragmented stacks create "trapped data" that AI cannot reach, limiting personalization, forecasting accuracy, and automation coverage.
According to Cirrus Insight, AI-enhanced sales teams are significantly more likely to achieve revenue growth, with 83% reporting increased revenue compared to 66% of non-AI teams. That gap widens when AI has access to consolidated data vs. siloed point-tool data.
Revenue leaders measuring AI readiness should track:
- % of contacts with complete enrichment data (name, title, company, phone, email, intent signals)
- % of outreach steps with AI-assisted personalization applied
- Forecast accuracy rate (a direct output of unified pipeline data)
- Time-in-stage by segment (easier to measure when all data lives in one system)
McKinsey's 2024 B2B Pulse analysis found data-driven commercial teams that combine generative AI with personalization are 1.7x more likely to increase market share than those not fully committed to either. That advantage is only achievable when your data is consolidated and accessible. Apollo's AI sales automation runs on a 230M+ contact database, giving teams the data foundation AI needs to deliver measurable lift from day one.
What Does a Strong Consolidation ROI Model Look Like?
A credible ROI model for switching to an all-in-one sales platform combines three value streams: cost reduction, revenue lift, and capacity reclaimed.
| Value Stream | What to Measure | How to Baseline |
|---|---|---|
| Cost Reduction | License spend eliminated, integration maintenance hours saved | Sum all replaced tool contracts + IT overhead |
| Revenue Lift | Win rate delta, pipeline conversion, deal cycle time | 90-day cohort comparison: pre vs. post migration |
| Capacity Reclaimed | Rep hours on non-selling activities before vs. after | Time-tracking audit or manager survey pre-migration |
The strongest consolidation stories combine all three. As Predictable Revenue put it after switching to Apollo: "We reduced the complexity of three tools into one." That simplicity translates directly into faster rep ramp, lower admin overhead, and more time selling. For a detailed breakdown of how consolidation reduces costs, read the Predictable Revenue customer story.
Finance teams increasingly expect NPV-based models that project value over a 12-to-24-month horizon, not just first-quarter cost saves. Build your model with conservative assumptions on revenue lift and lead with the cost-reduction numbers, which are easier to defend with actual contract data.
How to Structure Your 90-Day Measurement Plan After Switching
A 90-day measurement plan gives revenue leaders an early read on whether the platform switch is tracking toward its projected impact. Structure it in three phases:
- Days 1–30 (Adoption): Track active user rate, sequence enrollment, and data completeness. Flag adoption gaps early for targeted coaching.
- Days 31–60 (Activity): Measure outreach volume, meeting conversion rate, and stage progression velocity. Compare to pre-migration benchmarks.
- Days 61–90 (Revenue Signal): Review pipeline coverage, win rate on cohort opportunities created post-migration, and cost-per-meeting trends.
For enterprise GTM teams, add handoff SLA tracking (marketing-to-SDR, SDR-to-AE, AE-to-success) as a fourth dimension. Unified platforms improve handoff speed because context travels with the record, not in someone's inbox. Explore how leading teams structure their sales tech stack for scalable revenue to inform your own migration plan.

Start Measuring What Actually Moves Revenue
Revenue leaders who measure platform impact rigorously, starting with adoption and data quality before expecting win rate improvements, consistently build stronger business cases and capture more value from consolidation. The integration-to-value gap is real, but it is closeable with the right metrics and a structured 90-day review cadence.
Apollo gives B2B GTM teams, from SDRs to enterprise revenue leaders, a unified platform for prospecting, engagement, AI automation, and deal management. Trusted by nearly 100K paying customers including Anthropic, Cyera, and Smartling, Apollo consolidates your sales tech stack without sacrificing capability. As Cyera put it: "Having everything in one system was a game changer."
Start Free with Apollo and build your revenue impact scorecard on a platform that gives your AI, your reps, and your RevOps team a single source of truth.
Prove Pipeline ROI Before Next Quarter
ROI pressure killing your tool adoption? Apollo delivers measurable pipeline impact fast — 46% more meetings with AI, +10% win rates, +10% ACV. See results your CFO can't argue with.
Schedule a Demo →Don't miss these
Sales
Inbound vs Outbound Marketing: Which Strategy Wins?
Sales
What Is a Sales Funnel? The Non-Linear Revenue Framework for 2026
Sales
What Is a Go-to-Market Strategy? The 2026 GTM Playbook
See Apollo in action
We'd love to show how Apollo can help you sell better.
By submitting this form, you will receive information, tips, and promotions from Apollo. To learn more, see our Privacy Statement.
4.7/5 based on 9,015 reviews
