
Sales Analysis: How to Turn Data Into Revenue Growth
Sales analysis has evolved from spreadsheet guesswork to AI-powered intelligence that predicts deal outcomes and identifies revenue gaps. In 2026, top-performing teams use omnichannel analytics to track buyer behavior across 11+ touchpoints, aligning marketing and sales around shared metrics that drive predictable growth. Modern sales analytics platforms consolidate data from CRM, email, calls, and web activity into unified dashboards that RevOps teams, Account Executives, and Sales Leaders rely on for real-time decision-making.
Apollo Eliminates 4+ Hours Of Daily Research
Tired of spending 4+ hours daily hunting for contact info? Apollo delivers 224M verified contacts with 96% email accuracy—instantly. Join 550K+ companies who replaced manual research with predictable pipeline.
Start Free with Apollo →Key Takeaways
- Sales analysis combines CRM data, buyer signals, and AI predictions to identify which deals will close and which need intervention
- According to McKinsey, 42% of B2B buyers now use 11+ touchpoints, making omnichannel tracking essential for accurate attribution
- Unified GTM platforms like Apollo cut tech stack costs by replacing 3-5 separate tools while improving data accuracy to 96%
- AI-powered analysis helps SDRs and AEs prioritize high-intent accounts, increasing meeting bookings by 46% and conversions by 35%
- Marketing-sales alignment through shared dashboards and SLAs reduces wasted budget and improves pipeline quality
What Is Sales Analysis?
Sales analysis is the systematic examination of sales data, buyer behavior, and pipeline metrics to identify trends, forecast revenue, and optimize go-to-market strategies. It transforms raw CRM data into actionable insights that help teams close more deals faster.
Modern sales analysis goes beyond basic reporting. It combines quantitative metrics (conversion rates, deal velocity, win rates) with qualitative signals (buyer engagement, competitive intelligence, conversation sentiment). For B2B sales organizations, this means tracking every interaction from first touch to closed-won, then using that data to replicate success patterns.
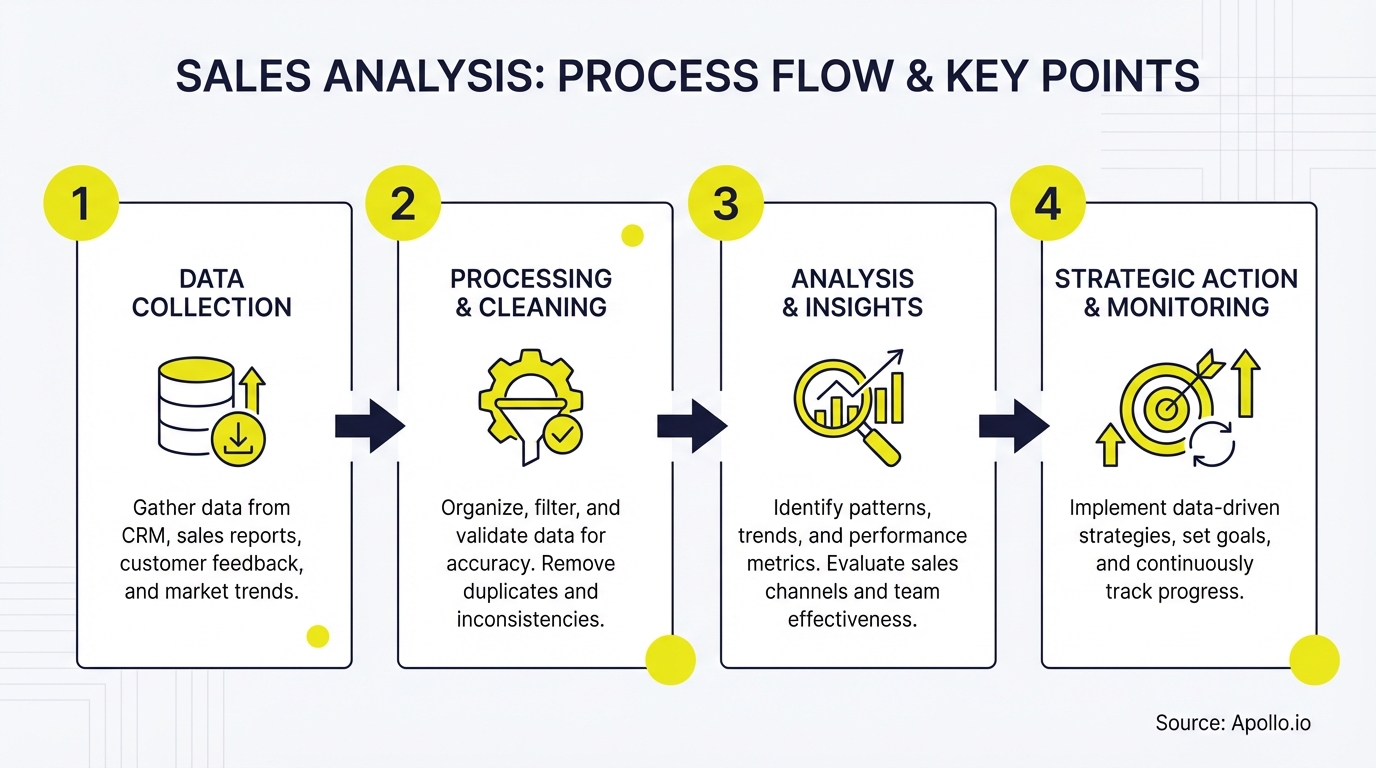
The discipline covers four core areas:
- Descriptive analysis: What happened? (historical performance, closed deals, lost opportunities)
- Diagnostic analysis: Why did it happen? (win/loss factors, bottlenecks, conversion drop-offs)
- Predictive analysis: What will happen? (AI-driven deal scoring, revenue forecasting, churn prediction)
- Prescriptive analysis: What should we do? (next-best actions, resource allocation, territory optimization)
Struggling to connect your sales data across multiple tools? Apollo's unified GTM platform consolidates prospecting, engagement, and analytics in one workspace.
Why Is Sales Analysis Critical in 2026?
Sales analysis has become mission-critical because buyer behavior has fundamentally changed. Research by McKinsey shows that e-commerce now accounts for 34% of B2B revenue, surpassing in-person sales, while buyers engage through 11+ touchpoints before making decisions.
Without rigorous analysis, teams miss critical signals. A prospect researching your pricing page three times in a week is showing high intent.
An AE losing deals at the same stage repeatedly indicates a process breakdown. Sales Leaders who track these patterns coach their teams to fix problems before they compound.

Data from Martech reveals that 50% of B2B marketers missed their 2024 goals, with 44% citing marketing-sales misalignment as a primary factor. Sales analysis bridges this gap by providing shared visibility into what's working. When marketing sees which lead sources convert to closed-won revenue, they optimize spend. When sales sees which campaigns drive qualified pipeline, they prioritize follow-up.
For Founders and CEOs, sales analysis answers existential questions: Is our GTM strategy working? Are we spending efficiently?
Can we scale predictably? For RevOps teams, it means clean data, accurate forecasts, and single-source-of-truth reporting that eliminates finger-pointing between departments.
How Do Sales Leaders Use Analytics to Drive Revenue?
Sales Leaders use analytics to diagnose performance gaps, forecast accurately, and coach teams at scale. They track leading indicators (activity metrics, pipeline coverage) and lagging indicators (bookings, revenue) to spot problems early.
Top-performing leaders build dashboards that answer five questions:
- Pipeline health: Do we have 3-5x coverage to hit quota? Are deals progressing or stalling?
- Activity benchmarks: Are SDRs hitting 50+ daily activities? Are AEs conducting enough discovery calls?
- Conversion rates: Where do deals fall out? Is it qualification, demo-to-close, or pricing objections?
- Win/loss patterns: Which competitors are we losing to? What features or pricing drive wins?
- Rep performance: Who's crushing quota? What behaviors can we replicate across the team?
Sales Leaders also use analytics for territory planning and quota setting. If analysis shows that enterprise deals take 120 days to close but mid-market closes in 45 days, they adjust team focus and compensation accordingly. Enterprise sales teams need different metrics than velocity-focused SMB teams.
The best leaders share weekly scorecards with transparent metrics. This creates accountability and healthy competition.
When reps see peer benchmarks, they ask for coaching on specific skills rather than generic "work harder" feedback.
How Do Account Executives Use Analysis to Close More Deals?
Account Executives use deal-level analysis to prioritize high-intent accounts and tailor their approach based on buyer signals. They track engagement metrics (email opens, content downloads, pricing page visits) to time outreach perfectly.
AEs analyze past wins to identify patterns. If deals with 3+ stakeholders involved close 40% faster, they multi-thread early. If technical demos scheduled within 7 days of first call have 2x win rates, they push for faster progression. Deal management platforms surface these insights automatically, eliminating manual spreadsheet analysis.
Competitive intelligence is another key use case. When an AE sees a prospect evaluating three vendors, analysis of previous competitive deals reveals which features to emphasize and which objections to preempt. Sales pitch techniques improve when backed by data showing what messages resonate with similar buyers.
Turn Forecast Guesswork Into Revenue Confidence
Pipeline forecasting a guessing game? Apollo delivers real-time deal visibility with buyer intent signals that predict which opportunities will close. Built-In increased win rates 10% using Apollo's scoring.
Start Free with Apollo →What Data Sources Power Modern Sales Analysis?
Comprehensive sales analysis requires integrating data from multiple sources into a unified view. Fragmented data across CRM, marketing automation, call recording, and analytics tools creates blind spots that cost revenue.
| Data Source | Key Metrics | Analysis Use Cases |
|---|---|---|
| CRM (Salesforce, HubSpot) | Deal stages, close dates, win/loss reasons, account history | Pipeline forecasting, conversion analysis, territory performance |
| Sales Engagement | Email open rates, call connection rates, sequence performance | Outreach optimization, rep activity benchmarks, message testing |
| Conversation Intelligence | Talk-to-listen ratio, objection frequency, competitor mentions | Coaching opportunities, competitive positioning, deal risk scoring |
| Marketing Automation | Lead source, campaign attribution, content engagement, MQLs | ROI analysis, channel optimization, lead quality assessment |
| Product Usage Data | Feature adoption, user activity, trial behavior, expansion signals | Upsell targeting, churn prediction, product-led sales triggers |
| Web Analytics | Page visits, time on site, pricing page views, return frequency | Intent scoring, buyer journey mapping, account-based targeting |
The challenge? Most teams use 5-8 separate tools, creating integration headaches and data silos.
RevOps spends hours building reports instead of analyzing insights. As Census reported: "We cut our costs in half" by consolidating onto a unified platform.

AI-powered platforms now enrich this data automatically. AI sales tools append firmographic data, track buying signals, and score accounts based on fit and intent without manual work. This gives SDRs and BDRs clean, actionable data instead of outdated contact lists.
How Do SDRs and BDRs Use Analytics to Book More Meetings?
SDRs and BDRs use analytics to identify which accounts to target, which messages to send, and when to reach out. They rely on three types of analysis: account scoring, activity tracking, and message performance.
Account scoring combines firmographic fit (company size, industry, tech stack) with behavioral intent (website visits, content downloads, job changes). SDRs focus on accounts scoring 80+ out of 100, knowing these convert 3x higher than cold outreach to unqualified lists.
Activity tracking ensures reps hit benchmarks. Top-performing SDRs make 50-80 touches daily across email, phone, and LinkedIn. Analytics dashboards show daily/weekly activity vs. quota, highlighting when reps fall behind before it impacts pipeline.
Message performance reveals what works. If subject line A gets 35% open rates while subject line B gets 18%, teams double down on A. If LinkedIn social selling generates 2x more replies than cold email for a specific persona, SDRs shift channel mix.
BDRs managing inbound leads use speed-to-lead analysis. Data consistently shows that responding within 5 minutes increases connection rates by 10x compared to 30-minute response times. Meeting scheduling automation eliminates back-and-forth, letting SDRs book demos instantly while the prospect is engaged.
What Are the Key Metrics for Sales Analysis?
Effective sales analysis tracks both activity metrics (inputs) and outcome metrics (results). Sales Leaders balance leading indicators that predict future performance with lagging indicators that measure actual results.
| Metric Category | Key Metrics | Why It Matters |
|---|---|---|
| Pipeline Metrics | Pipeline coverage ratio, deal velocity, stage conversion rates, pipeline value by source | Forecasts future revenue, identifies bottlenecks, shows which channels drive quality pipeline |
| Activity Metrics | Calls/emails per day, connection rate, meeting booked rate, response time | Predicts future pipeline generation, highlights rep productivity, identifies coaching needs |
| Conversion Metrics | Lead-to-opportunity %, opportunity-to-close %, win rate by segment, average deal size | Shows sales process efficiency, reveals where deals fall out, guides resource allocation |
| Efficiency Metrics | Sales cycle length, time in stage, quota attainment %, cost per acquisition | Measures team productivity, identifies process delays, calculates ROI |
| Quality Metrics | Win/loss ratio, competitive win rate, customer acquisition cost, customer lifetime value | Assesses deal quality, competitive positioning, long-term profitability |
The best teams create tiered dashboards. Executives see revenue, pipeline, and forecast accuracy.
Sales Leaders see team performance, conversion rates, and activity benchmarks. Individual reps see their personal metrics, quota progress, and deal health scores.
One critical but often overlooked metric: data quality. If 30% of your contact records have invalid emails or outdated job titles, your entire analysis is built on a shaky foundation.
Apollo maintains 96% email accuracy across 224M+ verified business contacts, ensuring analysis reflects reality.
How Can Teams Implement Sales Analysis Successfully?
Successful sales analysis implementation requires clean data, unified systems, and team adoption. Most initiatives fail not from lack of ambition but from poor execution and change management.
Start with data hygiene. Audit your CRM for duplicate records, missing fields, and outdated information. Establish data governance rules: required fields for opportunity creation, standardized picklist values, automated enrichment. RevOps teams report spending 40% less time on data cleanup after implementing automated enrichment.
Consolidate your tech stack. Teams using separate tools for prospecting, engagement, enrichment, and analytics face integration headaches and data silos. As Predictable Revenue noted: "We reduced the complexity of three tools into one." Modern sales platforms unify these functions, giving teams single-source-of-truth reporting.
Build role-specific dashboards. SDRs need activity tracking and meeting booked rates. AEs need deal health scores and competitive win rates. Sales Leaders need pipeline coverage and forecast accuracy. Avoid one-size-fits-all dashboards that overwhelm users with irrelevant metrics.
Establish regular review cadences. Daily standup reviews activity metrics. Weekly pipeline reviews assess deal progression. Monthly business reviews analyze trends and set targets. Quarterly strategic reviews evaluate GTM effectiveness and make major adjustments.
Train teams on interpretation. Data alone doesn't drive action. Sales Leaders must teach reps how to read dashboards, identify red flags, and take corrective action. When a deal sits in "Proposal Sent" for 14 days, what should the AE do? When an SDR's connection rate drops 20%, what skills need coaching?
What Role Does AI Play in Modern Sales Analysis?
AI transforms sales analysis from reactive reporting to predictive intelligence. Instead of telling you what happened last quarter, AI predicts which deals will close, which accounts to prioritize, and what messages will resonate.
Deal scoring uses machine learning to analyze thousands of closed deals, identifying patterns that predict outcomes. AI evaluates deal size, stage duration, stakeholder engagement, and competitive factors to assign probability scores. This helps AEs focus on winnable deals and intervene early on at-risk opportunities.
Next-best-action recommendations guide reps through optimal workflows. When an AE closes a discovery call, AI suggests: "Schedule technical demo within 48 hours—deals with faster progression convert 35% higher." When an SDR's email gets no response after three touches, AI recommends switching channels or trying a different value proposition.
Automated insights surface anomalies humans would miss. If win rates drop 15% in the Northeast territory, AI flags it immediately. If a specific competitor suddenly appears in 40% of new deals, AI alerts the team to adjust positioning. AI sales automation platforms monitor hundreds of metrics continuously, acting as an always-on analyst.
Conversation intelligence analyzes recorded calls for coaching moments. AI identifies when AEs talk too much (poor discovery), fail to handle objections effectively, or miss buying signals. Sales Leaders coach with specific examples rather than generic feedback.
Apollo's AI Research Agent helps SDRs research accounts 10x faster, while AI-powered messaging increases meeting bookings by 46%. As Cyera reported: "Having everything in one system was a game changer" for leveraging AI across the entire sales process.
Start Analyzing Sales Data That Drives Revenue
Sales analysis in 2026 separates winning teams from those stuck in reactive mode. By combining clean data, unified platforms, and AI-powered insights, sales organizations predict outcomes, optimize processes, and scale predictably.
The teams that excel share common traits: they consolidate tools to eliminate data silos, they track both activity and outcome metrics, and they use AI to automate analysis rather than manual spreadsheet wrangling. They align marketing and sales around shared definitions and dashboards.
Most importantly, they act on insights immediately rather than letting reports gather dust.
For SDRs, this means knowing exactly which accounts to call today. For AEs, it means understanding which deals need attention and why.
For Sales Leaders, it means coaching with data-backed evidence and forecasting with confidence. For Founders and RevOps teams, it means proving GTM ROI and making investment decisions based on facts, not hunches.
Ready to stop stitching together multiple tools and start analyzing from a single source of truth? Start a free trial and see how Apollo's unified GTM platform gives you 224M+ verified contacts, AI-powered insights, and complete sales analytics in one workspace.
Prove Apollo's ROI In Your First 30 Days
Budget approval stuck on unclear metrics? Apollo tracks every dollar—from first touch to closed deal. Built-In increased win rates 10% and ACV 10% using Apollo's ROI dashboard.
Start Free with Apollo →Don't miss these
Sales
Inbound vs Outbound Marketing: Which Strategy Wins?
Sales
What Is a Sales Funnel? The Non-Linear Revenue Framework for 2026
Sales
What Is a Go-to-Market Strategy? The 2026 GTM Playbook
See Apollo in action
We'd love to show how Apollo can help you sell better.
By submitting this form, you will receive information, tips, and promotions from Apollo. To learn more, see our Privacy Statement.
4.7/5 based on 9,015 reviews
