
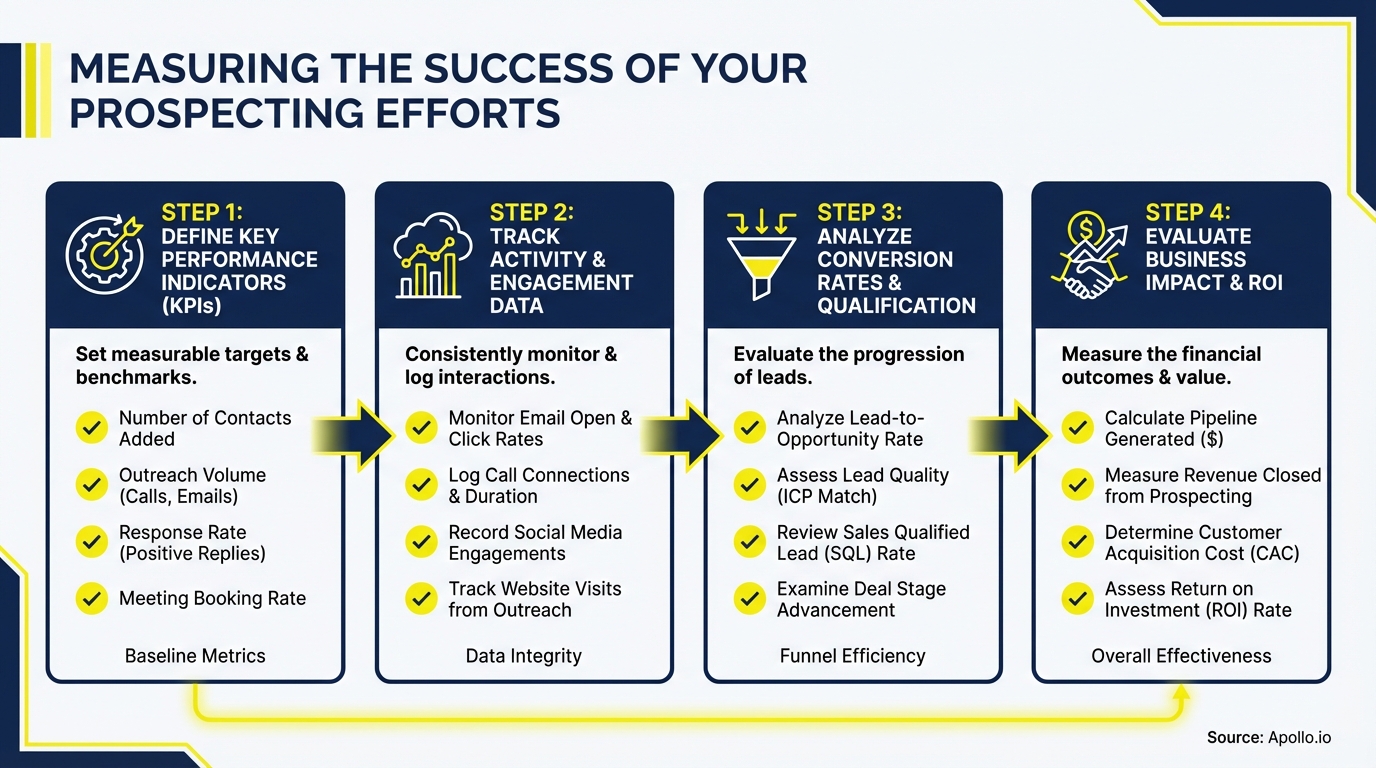
How Do I Measure the Success of My Prospecting Efforts in 2026?
Most sales teams track the wrong things. They report on activity volume, raw reply rates, and meetings booked, then wonder why pipeline looks thin at quarter's end. The real question is not how much prospecting you did, but whether it moved the right buyers forward. With outbound prospecting growing more competitive, measurement needs to get sharper, not just bigger.
This guide gives SDRs, BDRs, RevOps leaders, and sales managers a practical measurement framework built for how B2B buyers actually behave in 2026.
Research Less, Pipeline More With Apollo
Tired of burning hours verifying contact info before a single email goes out? Apollo delivers 230M+ verified contacts so your team sells instead of searches. Start building pipeline today.
Start Free with Apollo →Key Takeaways
- Replace vanity metrics (open rate, raw reply rate) with a conversion efficiency funnel: delivered → positive reply → qualified meeting → opportunity → pipeline.
- Negative buyer signals (opt-outs, avoidance, unsubscribes) are measurable KPIs, not background noise.
- SDRs and BDRs should track pipeline created, not just meetings set, to align with RevOps expectations in 2026.
- List quality metrics (bounce rate, verified contact rate) directly predict conversion efficiency downstream.
- A message-match audit between your outreach sequences and your ICP-facing pages reduces late-stage friction and improves meeting-to-opportunity rates.
Why Do Traditional Prospecting Metrics Fall Short?
Traditional metrics fail because they measure effort, not outcomes. Tracking dials made, emails sent, or raw reply rate tells you how busy your team is, not whether your outreach is resonating with buyers.
Consider: a high reply rate inflated by "remove me" responses is worse than a low positive reply rate from genuinely interested prospects. Meanwhile, according to Trykondo, only 16% of sales reps hit quota in 2023, a significant drop from historical norms. That gap traces directly back to measuring the wrong signals.
The fix is a layered scorecard that connects prospecting activity to pipeline outcomes through a clear conversion chain.
What Is the Prospecting Conversion Efficiency Funnel?
The conversion efficiency funnel is a stage-by-stage measurement model that tracks how prospecting touchpoints convert into real pipeline. It replaces activity counts with ratios that reveal where value is created or lost.
| Funnel Stage | Metric to Track | Why It Matters |
|---|---|---|
| Outreach Delivered | Deliverability rate, bounce rate | Poor inbox placement makes all downstream metrics meaningless |
| Engagement | Positive reply rate (not total reply rate) | Filters out opt-outs and removes noise from reporting |
| Meeting Booked | Meeting booked rate, time-to-first-meeting | Speed to meeting predicts deal velocity downstream |
| Meeting Quality | Show rate, qualified meeting rate | High-performing teams aim for 15+ qualified meetings monthly, per Rachel A. Krug |
| Opportunity Created | Meeting-to-opportunity conversion rate | The average B2B conversion rate across all industries is 2.9%, per Predictable Profits |
| Pipeline Generated | Pipeline value sourced, pipeline coverage contribution | Ties SDR/BDR activity directly to revenue forecasts |
Struggling to track this funnel in one place? Apollo's sales pipeline tools give your team full visibility from first touch to closed deal, without stitching together multiple platforms.
How Do SDRs and BDRs Measure Prospecting Success in 2026?
SDRs and BDRs should measure prospecting success by pipeline created and accepted, not just meetings set. This shift aligns frontline prospecting with RevOps expectations and makes SDR performance directly comparable to revenue impact.
Key metrics for SDRs and BDRs in 2026:
- Pipeline accepted rate: What percentage of SDR-sourced opportunities get accepted by AEs as qualified?
- Pipeline coverage contribution: How much of total pipeline did the SDR team source this quarter?
- Win rate of SDR-sourced opportunities: Do SDR-generated deals close at a comparable rate to inbound?
- Time-to-first-meeting: How quickly does a new prospect reach a booked call after first outreach?
- List quality metrics: Bounce rate and verified contact rate on prospecting lists, since low-quality lists waste effort before a single email lands.
For RevOps leaders building dashboards, these metrics create a feedback loop: if SDR-sourced pipeline has a lower win rate, that signals a targeting or qualification problem upstream, not just a closing problem downstream. Pairing these metrics with data-driven prospecting strategies closes that loop faster.

What Are Negative Buyer Signals and Why Should You Measure Them?
Negative buyer signals, including opt-outs, spam complaints, and unsubscribes, are direct indicators that your outreach is missing the mark with your ICP. They should be tracked as primary KPIs, not filtered out of reports.
Tracking negative signals surfaces problems that positive metrics hide:
- Opt-out rate by segment: High opt-outs in a specific persona or industry signal poor targeting or irrelevant messaging.
- Spam complaint rate: A rising spam complaint rate damages sender reputation and inbox placement for your entire domain, not just one campaign.
- Avoidance signals: No-shows, declined meeting requests, and ghosting after positive replies all indicate a gap between your outreach promise and reality.
A useful complement to negative signal tracking is a message-match audit: compare the language in your outreach sequences against the top pages your ICP visits on your website. When those messages conflict, meeting-to-opportunity conversion drops. This directly connects to email personalization best practices that keep your outreach relevant and on-brand.
Turn Funnel Guesswork Into Real Pipeline
Pipeline forecasting a guessing game because marketing leads never convert? Apollo surfaces high-intent prospects ready to buy, not just fill a spreadsheet. Top revenue teams use Apollo to build pipeline they can actually count on.
Schedule a Demo →How Do You Measure Multi-Channel Prospecting Performance?
Multi-channel prospecting performance is measured by attributing pipeline contribution to each channel combination, not by treating email, phone, and social as separate scorecards.
B2B buyers now split their time across digital self-service, remote, and in-person interactions. That means a prospect who replies to an email may have first encountered your brand through a social touch or a content asset.
Single-channel reply rate misses this entirely.
A practical multi-touch attribution approach:
- Tag every touchpoint (email, call, social, content view) in your CRM against the account record.
- Measure first-touch, last-touch, and assisted-touch contribution to each opportunity created.
- Track which sequence types (email-only vs. email + phone vs. full multi-channel) produce the highest meeting-to-opportunity rate.
- For accounts that go dark, identify the last touchpoint before disengagement to find messaging or channel failures.
According to HubSpot, 37% of sales representatives generate the most leads from phone calls during cold outreach, which underlines why removing phone from your attribution model creates blind spots. Building a sales tech stack that captures all channel data in one place is the prerequisite for reliable multi-touch measurement.
Spending hours stitching together channel data from separate tools? Apollo's multi-channel engagement platform tracks every touchpoint in one workspace, so your attribution data is always clean and complete.
What Does a Practical Prospecting Scorecard Look Like?
A practical prospecting scorecard groups metrics into three tiers: leading indicators (inputs), conversion efficiency (process), and pipeline outcomes (results). Reviewing all three weekly prevents teams from optimizing one layer at the expense of another.
| Tier | Metric | Cadence |
|---|---|---|
| Leading Indicators | Deliverability rate, bounce rate, spam complaint rate, verified contact rate | Weekly |
| Conversion Efficiency | Positive reply rate, qualified meeting rate, show rate, meeting-to-opp rate | Weekly / Bi-weekly |
| Pipeline Outcomes | Pipeline generated, pipeline accepted, pipeline coverage %, win rate of sourced opps | Monthly / Quarterly |
| Negative Signals | Opt-out rate by segment, no-show rate, avoidance rate | Weekly |
For AEs and sales leaders, the most predictive ratio is meeting-to-opportunity conversion. If that number drops while meetings booked stays flat, the targeting or qualification criteria upstream needs adjustment, not the closing motion downstream. Pair this scorecard with strong prospecting list hygiene and you eliminate most data quality issues before they reach the funnel.
How Do You Turn Prospecting Metrics Into Actionable Improvements?
Turning metrics into improvements requires assigning ownership to each scorecard tier and running structured experiments when a metric falls below threshold.
A simple improvement loop:
- Diagnose: Which funnel stage shows the biggest drop-off this week?
- Hypothesize: Is the issue targeting (wrong ICP), messaging (wrong value prop), or channel (wrong medium)?
- Test: Run an A/B sequence variation for two weeks against a control group.
- Measure: Compare positive reply rate and meeting-to-opp rate between variants.
- Scale or discard: Promote winning sequences; retire underperformers.
For example: if opt-out rate is rising in a specific vertical, run a message-match audit by comparing your sequence copy against your top ICP-facing pages for that segment. Misaligned language between what reps say and what your website promises is a fixable problem once you can see it in the data. This connects directly to building a stronger intent-driven prospecting approach that matches message to buyer stage.

Start Measuring What Actually Moves Pipeline
Measuring prospecting success in 2026 means tracking a layered scorecard: leading indicators, conversion efficiency, pipeline outcomes, and negative buyer signals. SDRs and BDRs who shift from meetings-set to pipeline-created metrics align their work with what sales leaders and RevOps actually care about.
AEs who monitor meeting-to-opportunity rates catch targeting problems before they drain quota attainment.
The teams winning on outbound are not the ones sending the most, they are the ones measuring the right things and iterating fastest. Apollo gives your entire GTM team, from SDRs to RevOps, one unified workspace to track every touchpoint, score every sequence, and connect prospecting activity directly to pipeline.
As Cyera put it: "Having everything in one system was a game changer."
Start Free with Apollo and build a prospecting measurement system that connects every touch to pipeline, without the spreadsheet chaos.
Prove Pipeline ROI With Apollo
Budget approval stuck on unclear metrics? Apollo gives revenue teams measurable pipeline impact from day one. Leadium 3x'd annual revenue — see your ROI before the next renewal conversation.
Start Free with Apollo →Don't miss these
Sales
Inbound vs Outbound Marketing: Which Strategy Wins?
Sales
What Is a Sales Funnel? The Non-Linear Revenue Framework for 2026
Sales
What Is a Go-to-Market Strategy? The 2026 GTM Playbook
See Apollo in action
We'd love to show how Apollo can help you sell better.
By submitting this form, you will receive information, tips, and promotions from Apollo. To learn more, see our Privacy Statement.
4.7/5 based on 9,015 reviews
