In late 2024, I sat down to prototype a Chrome Extension. I expected this task to take days building tedious boilerplate code. Instead, I used Cursor, an AI-native editor we had just started testing after trialing Github Copilot. I gave it a prompt, and in two minutes, it generated an end-to-end extension that worked on the first try.
That was my "Innovation Trigger". I spent the next 10 days building 15 different iterations of browser automation prototypes. I became a "drum-beater" for AI, annoying my colleagues with my excitement. But as Keshav and I rolled out AI tools like Cursor, Windsurf, BugBot, CodeRabbit, etc. across our 250+ person engineering team, we learned that the path from simple adoption to true engineering mastery was filled with surprising and counter-intuitive lessons.
Here is exactly how we moved past the "vanity metrics" to find the real truth about AI productivity at Apollo, which has a 10-year-old monolith repository with contributions from 250+ engineers on a daily basis. This post covers three specific things:
- The specific metrics we tracked 🧮
- What worked and what didn't 📚
- The actual productivity gains we measured 📈
We understand that due to our specific setup, these findings may not be generalizable, since smaller and less restrictive codebases and teams may have different experiences. But our AI tooling journey provides good data points to other similar organizations who are trying to figure out their path forward in AI tooling adoption.
The Reality Check: 15% Gains, Not 10x Hype
The industry promised us 10x Engineers. After a year of measurement across 250+ engineers, the data showed us something different: we didn't get 10x engineers, we unlocked a 1.15x engineering organization.
Let's start with the bottom line. After a full year of measurement and 92% weekly active usage of Cursor, here's what we found:
- Perceived Velocity: Engineers reported ~15% productivity improvements (with some power users hitting 2-3x)
- Actual Throughput: Cycle time (first commit to deployment) remained flat
- Sentiment: The average "Self-reported AI Speed Impact" score (where engineers give a score between 0 and 5 on how much of a speed boost they got via AI tools in their PRs) was 2.23 out of 5
Why the discrepancy?
We found that AI is incredible at collapsing the time required for discrete tasks, but it cannot yet accelerate the entire software delivery lifecycle. It can write a test in seconds, but it cannot speed up our CI pipeline, bypass necessary code reviews, or resolve architectural debates on a 10-year-old monolith.
When we isolated specific coding activities, the gains were undeniable:
| Task | Before AI | After AI | Measured Improvement |
|---|---|---|---|
| Test generation | 30 minutes | 5 minutes | 6x faster |
| Boilerplate code | Hours | Seconds | Instant |
| Technical unblocking | Days | Single sessions | Qualitative shift |
Key finding: AI tools provided measurable speed improvements for discrete coding tasks, but these gains didn't compound into proportional increases in overall engineering velocity.
Why Measuring Adoption Masked the Truth
We kicked off 2025 with a clear target: 80%+ adoption of Cursor. To achieve this, we launched the Cursor Champions Committee, led by Keshav. We asked for volunteers from across engineering to drive adoption on their teams, identifying engineers with high curiosity and ownership to lead the charge.
The strategy worked. By the end of Q1, we hit 85% Weekly Active Users (106% of our goal), with Monthly Active Users exceeding 90%.
Initially, this felt like a massive victory. But as we dug into the data, we realized that "Active User" was a vanity metric. It counted an engineer pressing Tab for a single autocomplete the same as an engineer using AI Agents to architect a complex solution. We were measuring activity, not value.
To get to the truth, we bypassed the standard vendor dashboards. We exported Cursor's raw usage logs into Snowflake and built a Weighted Effectiveness Score to differentiate between passive usage and active problem solving:
USAGE_SCORE = (AGENT_REQUESTS × 2.0) + (APPLIED_SUGGESTIONS × 1.0) + (TABS_SHOWN × 0.05)
The multipliers reflected intent:
- Agent requests (2.0x): High intent, active problem-solving
- Applied suggestions (1.0x): Standard acceptance behavior
- Tabs shown (0.05x): Passive exposure
Crucially, we applied logarithmic smoothing (ln(1 + n)) over a rolling 4-month window for each input. This ensured that daily usage spikes were dampened, making the score a measure of sustained habit formation rather than sporadic bursts.
This allowed us to segment our engineers into five cohorts:
| Cohort | % of Team | Usage Score Range |
|---|---|---|
| Super Power Users | 2% | >10,000 |
| Power Users | 8% | 6,000-10,000 |
| Active Users | 41% | Moderate |
| Moderate Users | 29% | Low |
| Passive Users | 20% | Minimal |
The data showed that only 2% of our engineers were using AI tools to their full potential. The remaining 98% of our "adopted" user base was using the tools at a much more basic level.
Key takeaway: Standard adoption metrics (WAU, MAU) masked significant variation in usage depth. Custom effectiveness scoring was necessary to understand actual value delivery.
Frontend and Backend Showed Significantly Different Results
When we segmented our data by engineering discipline, we found different patterns.
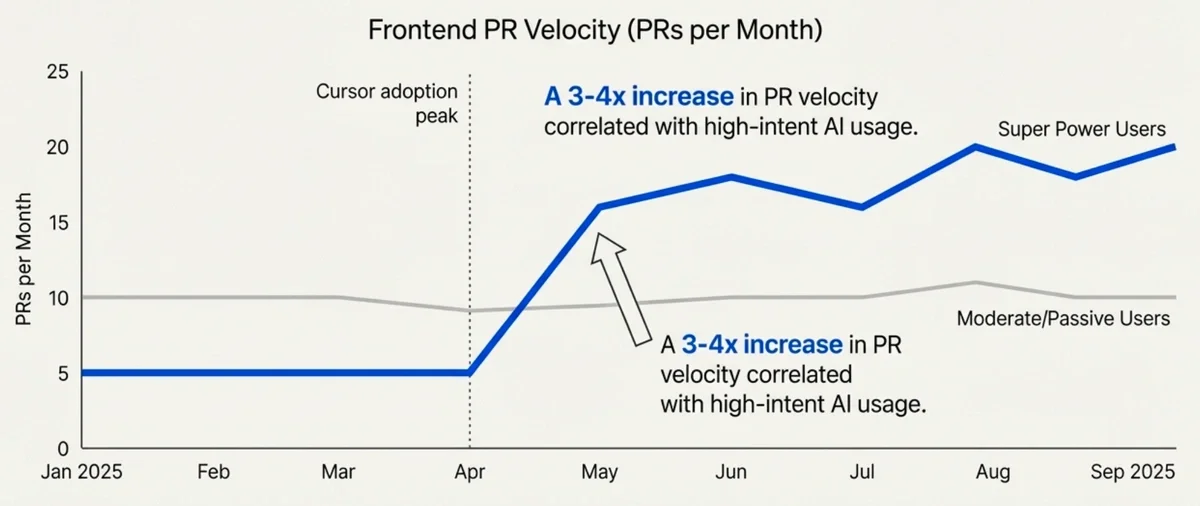
Frontend Engineers (Super Power Users):
- PR velocity increased from ~5 PRs/month to 16-20 PRs/month
- This represented a 3-4x improvement in output
- Self-reported AI impact scores (that we had asked engineers to submit via a PR description template) showed strong correlation with usage intensity
- Cycle time and lines of code changed were inconclusive
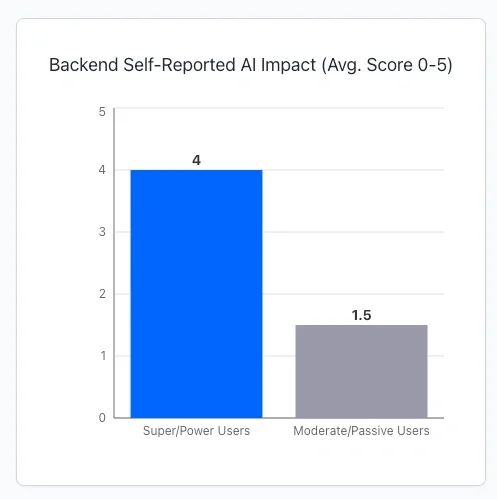
Backend Engineers:
- PR velocity showed no consistent correlation with AI usage
- Super Power Users didn't significantly outperform others in quantitative metrics
- Lines of code changed and cycle time were highly volatile
- However, Power Users did report higher perceived benefits in self-reported metrics
We investigated why Frontend showed clear gains while Backend didn't. The primary factor was context availability and how engineers were using context in their prompts.
Frontend teams had:
- Comprehensive
.cursorrulesfiles - Well-documented component libraries
- Standardized patterns and conventions
- Domain-specific prompts
- LLMs trained more on Javascript
- Super power users had mastered the art of providing the right context in the right scenario
Backend teams working in Ruby/Rails and infrastructure:
- 1 basic
.cursorrulesfile (vs. multiple in Frontend) - Sparse documentation
- Less standardized patterns (although more modularity via controllers, models, and proper class hierarchy)
- Infrastructure-specific complexity not well-captured
- LLMs trained less on Ruby compared to Javascript
- No super power users
This led to one of our core principles: AI tools are context amplifiers. They can help bootstrap documentation, but they require grounding to be effective.
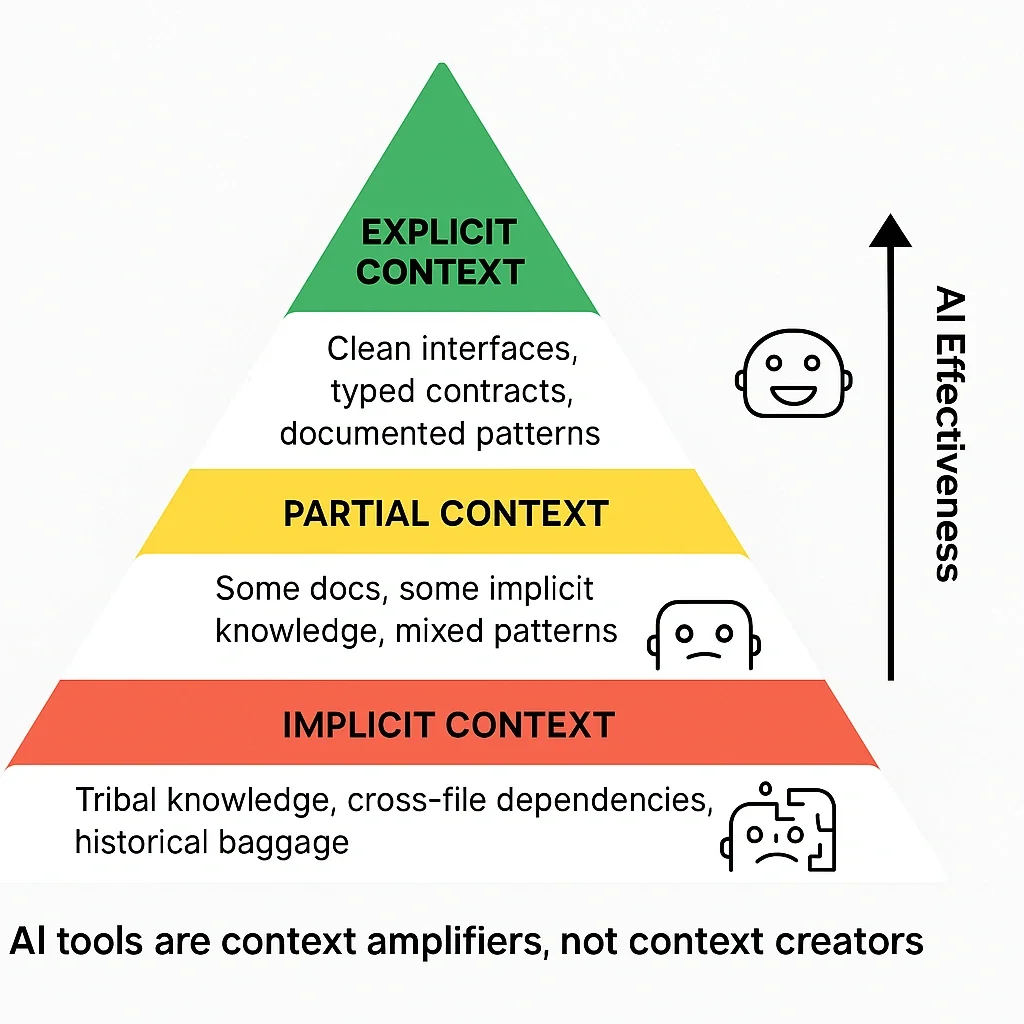
Critical insight: Productivity gains from AI tools correlated strongly with available context. Teams with better documentation and standardization saw significantly better results.
Speed Improvements Introduced Quality Concerns
By Q3, we had achieved high adoption and speed improvements, but our surveys revealed quality concerns:
We observed specific patterns:
- Auto-generated tests sometimes validated incorrect behavior
- Unit tests used random mocks to increase coverage without testing meaningful functionality
- Engineers merged AI-generated code without adequate review
- Technical debt accumulated faster than anticipated
To address this, we shifted our focus from "Speed" to "Guardrails." We implemented four specific measures:
- Custom lint rules: Deployed custom RuboCop rules to catch AI-specific patterns (e.g., redundant T::Sig usage). These block CI and log violations to our dashboard, ensuring we track and resolve "AI noise" before it merges.
- Quality gates: Wired GitHub Actions to our AI code-quality rubric to fail PRs when AI-generated diffs add known issues (weak error handling, missing tests, or violations of .cursorrules standards).
- Violation tracking: Introduced a Cumulative Improvement Score (CIS) to track RuboCop/ESLint violations in AI-generated code and drive team-level cleanup.
- PR review automation: Scaled BugBot coverage from 50% to 92% so AI review catches subtle logic and runtime bugs, freeing human reviewers to focus on architecture.
Important realization: Speed gains without quality guardrails created technical debt. Systematic quality measures were necessary to make AI adoption sustainable.
Our Metrics Evolution: From Vanity to Effectiveness
We deliberately used simple metrics early, then evolved them as we matured. Here's the progression:
| Stage | Duration | Primary Goal | Metric | Why This Metric |
|---|---|---|---|---|
| Adoption | Months 1-3 | Build habits | WAU, Lines of Code | Needed to establish consistent usage |
| Quality | Months 3-6 | Build trust | Survey Sentiment, Revert Rate | Validate that gains weren't creating problems |
| Effectiveness | Months 6+ | Optimize value | Custom Usage Score | Distinguish high-value from low-value usage |
In Q2, we tracked "AI-generated lines accepted" and set a goal to increase it by 70%. We knew this metric could be gamed, e.g. a formatter run could artificially boost the count. But at that stage, we prioritized habit formation over precision.
By Q3, we had transitioned to the weighted effectiveness score that differentiated between agent requests (high intent) and tab completions (passive). This gave us actionable data on who was using AI tools effectively versus who was just using them.
The Integration Breakthrough
However, generating this score and correlating it with actual productivity required data that wasn't available in any single dashboard. We realized that vendor analytics were optimized for showcasing usage, not ROI.
To solve this, we built a custom analytics pipeline in Snowflake that joined three distinct datasets:
- Usage: Raw Cursor logs (identifying Agent vs. Tab usage)
- Impact: Cycle time and revert rates from GitHub
- Trust: Per-PR impact scores and quarterly trust surveys
This triangulation was critical. It allowed us to validate claims, checking if engineers who "felt faster" (high sentiment) were actually "shipping faster" (low cycle time).
We also added mandatory PR template fields:
ai_speed_boost_impact(0-5 scale)ai_ideation_help_impact(0-5 scale)
By the end of Q3, we had tagged 196 PRs. While the manual tagging had friction, it provided the "ground truth" we needed to calibrate our automated scores.
Key takeaway: Vendor analytics are optimized for showcasing tool adoption, not ROI. To measure true impact, you must build infrastructure that correlates usage (logs) with outcomes (Git) and sentiment (surveys).
Squad Champions Outperformed Top-Down Initiatives
We tested multiple adoption strategies throughout the year. The most effective was the Cursor Champions Committee, which Keshav led.
The model:
- Asked for volunteers across engineering to drive adoption on their teams
- Champions met weekly for 1 hour to align on strategy
- Each Champion spent 1-2 hours per week coaching their squad
- Every Champion owned a squad-specific adoption plan
Sample Champion initiatives:
| Initiative Type | Examples |
|---|---|
| Quick Wins | Starter prompt libraries, pair programming sessions, squad-specific documentation |
| Coaching | Weekly pair programming with focus group members |
| Custom Rules | Test generation guidelines, PR description templates |
| Measurement | Team leaderboards, lines of code accepted tracking |
| Community Sharing | "Aha!" moments in #eng-cursor Slack channel |
The data showed clear patterns:
- Squads with engaged Cursor Champions saw consistent adoption
- Squads without Cursor Champions or with an Engineering Manager (EM) who was not bought in into AI tooling saw slower adoption
- By Q3, only 17% of squads (5 out of 29) achieved 75% or greater WAU, even though the overall adoption on the Engineering team was 85%+
We found that successful adoption required both peer champions and manager alignment. Champions provided technical expertise and enthusiasm; managers provided accountability and strategic prioritization.
Key finding: AI adoption is primarily an organizational change challenge, not a technical one. Peer-led initiatives with management support significantly outperformed top-down mandates.
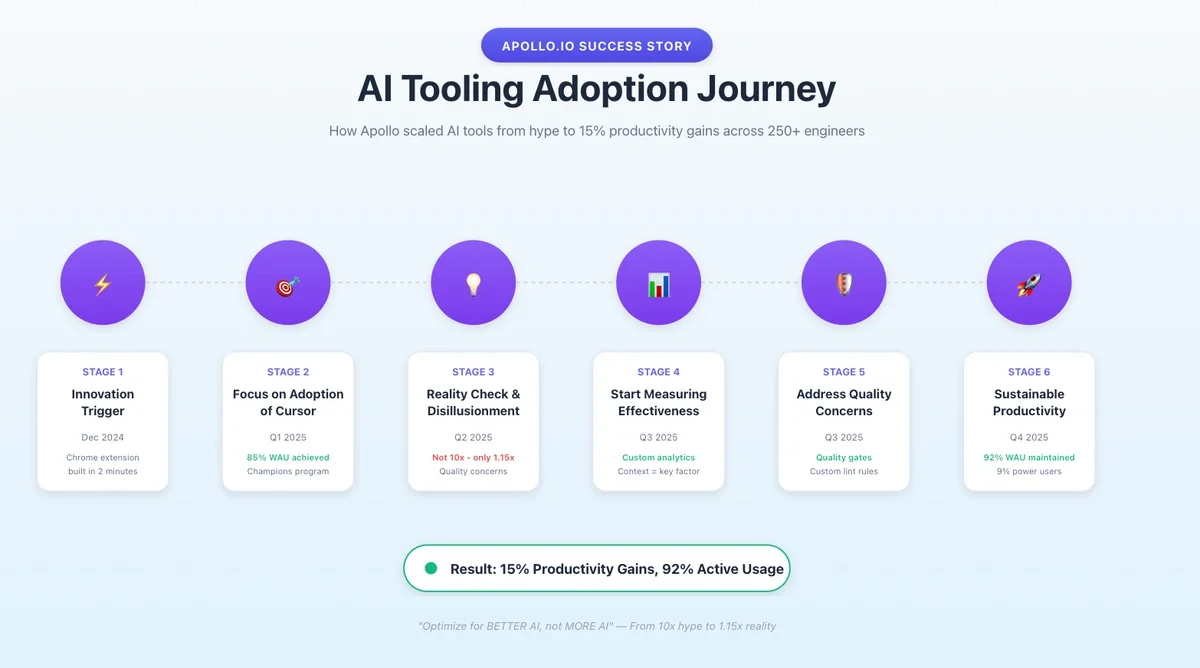
The Gartner Hype Cycle Matched Our Experience
Our year-long journey closely followed the Gartner Hype Cycle pattern.
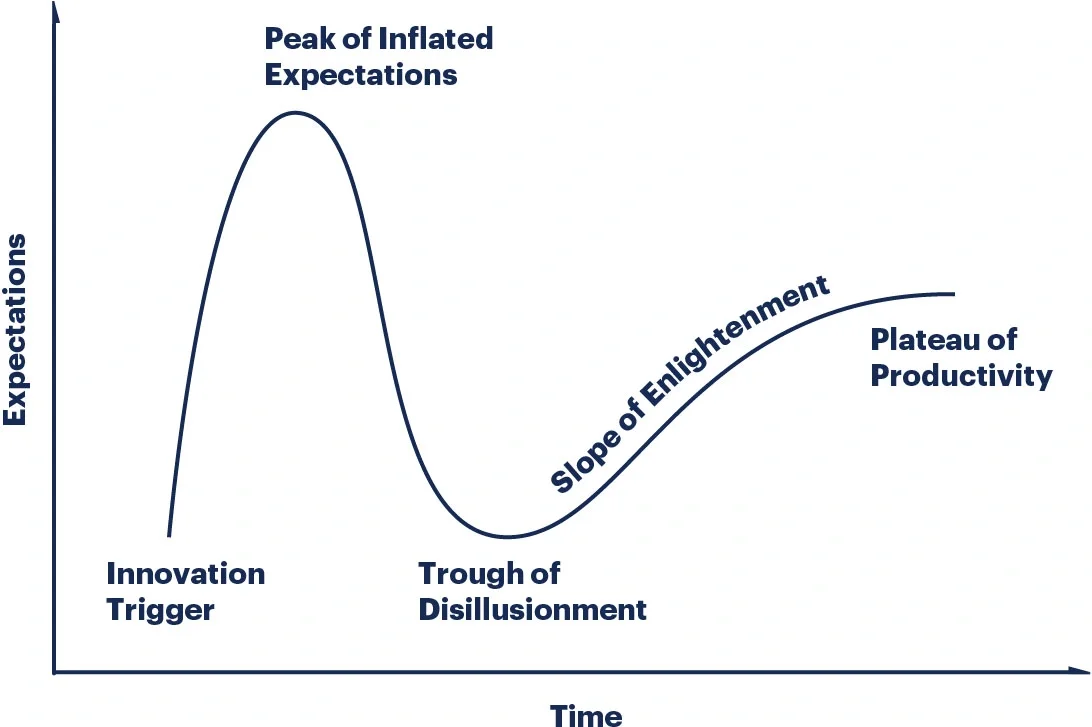
Innovation Trigger (December 2024)
- Cursor generated working Chrome extension in 2 minutes
- Initial excitement about capabilities
Peak of Inflated Expectations (Q1 2025)
- 85% adoption achieved
- Celebrating "lines of code" metrics
- Expecting major productivity improvements
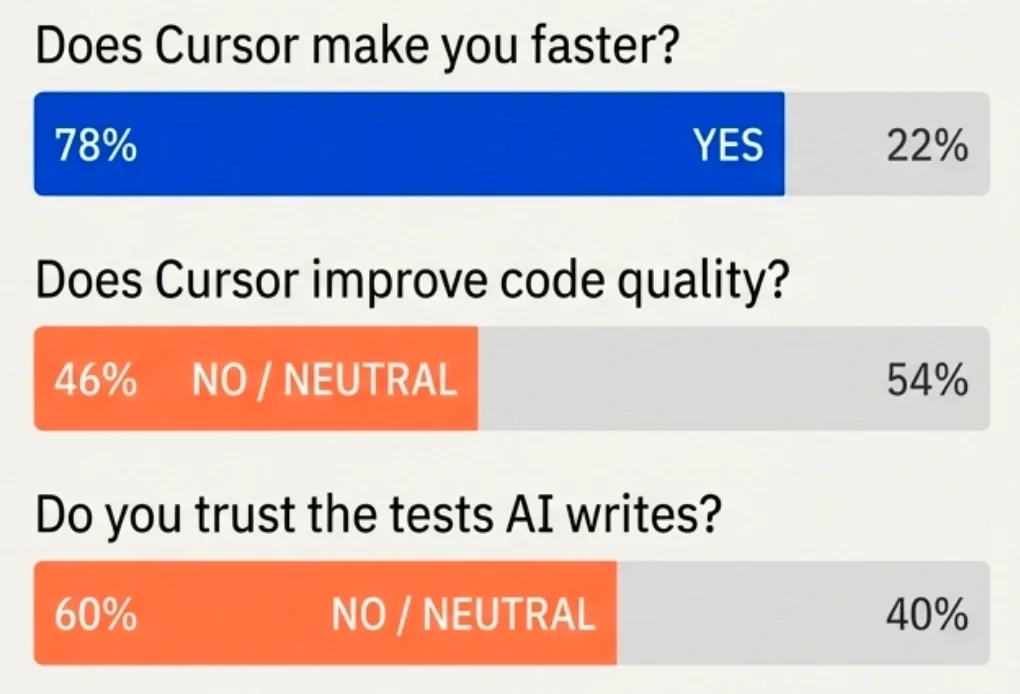
Trough of Disillusionment (Q2 2025)
- Cycle time showed no significant change
- Quality concerns emerged (60% didn't trust AI-generated tests)
- Self-reported speed boost median was only 2/5
- Senior engineers reporting 15% gains, not 10x
Slope of Enlightenment (Q3 2025)
- Cohort analysis revealed usage patterns
- Understood why Frontend succeeded while Backend didn't
- Identified that context engineering was the key variable
- Built measurement frameworks to track effectiveness
Plateau of Productivity (Q4 2025)
- Implemented quality gates and custom lint rules
- Created sustainable training infrastructure via interactive courses and documentation
- Established repeatable processes for new tool adoption
- Converted learnings into Cursor Commands for easy reuse
Our key decision in Q1 was to focus on adoption before measuring productivity. We believed that if engineers found genuine value, productivity gains would follow. This proved correct, but it took the full year to reach sustainable productivity improvements.
Key finding: Organizations cannot skip phases of the hype cycle. Attempting to jump directly to productivity measurement without establishing adoption, trust, and effectiveness will likely fail.
What We'd Do Differently
Looking back at our year-long journey, here's what we learned:
- Invest in context infrastructure: Frontend's success came from having good
.cursorrules, documentation, and best practices. We should have prioritized this for Backend from the start rather than treating it as an optimization. - Build custom analytics from day one: We spent months relying on vendor dashboards before building our own. The custom analytics were far more valuable and should have been prioritized earlier.
- Start quality measurement earlier: We waited until Q3 to systematically address quality concerns. By then, we had accumulated technical debt. Starting quality gates in Q2 would have prevented problems and helped us gain more trust with engineers.
- Set realistic expectations: The "10x productivity" hype created unrealistic expectations. Setting more modest goals (20-30% task-level improvements) would have managed expectations better.
- Survey more frequently: We ran quarterly surveys, but more frequent pulse checks (monthly) would have identified concerns earlier and allowed faster iteration.
The Playbook: A Phased Approach to Adoption
For engineering leaders considering similar initiatives, we recommend a three-phase organizational change program:
Phase 1: Adoption (Months 1-3)
- Primary Goal: Habit formation and cultural buy-in. Do not worry about ROI or complex analytics yet.
- Key Actions:
- Identify Champions: Find the 2-3 engineers on every squad who are naturally curious.
- Secure EM Buy-in: Ensure Managers are unblocking their teams to experiment.
- Celebrate "Quick Wins": Share small victories publicly (e.g., "Ryan generated this entire test suite in 30 seconds").
- Metrics to Watch: Weekly Active Users (WAU), % of Squads with at least 1 Power User.
Phase 2: Quality (Months 3-6)
- Primary Goal: Risk mitigation and trust building. As usage spikes, quality will become a concern.
- Key Actions:
- Deploy Guardrails: Implement custom lint rules (e.g., RuboCop, ESLint) specifically targeting common AI hallucinations or bad patterns.
- Standardize Context: Begin documenting your .cursorrules. Treat documentation as "infrastructure for AI."
- Pulse Surveys: Run monthly surveys specifically asking: "Do you trust the code generated by the tool?"
- Metrics to Watch: Revert rates on AI-generated PRs, Survey Sentiment ("Trust Score").
Phase 3: Effectiveness (Months 6+)
- Primary Goal: Value optimization and deep workflow integration. Move beyond "better autocomplete." Use data to drive behavior change from passive usage (Tab) to active problem solving (Agents).
- Key Actions:
- Build Custom Analytics: Implement the "Weighted Effectiveness Score" (Logs + Git data) to identify who is actually getting faster.
- Segment & Train: Identify the "Passive Users" and pair them with "Super Power Users" for specific workflow training.
- Invest in "Context Infrastructure": deeply engineer your codebases (types, modularity) to be LLM-friendly.
- Metrics to Watch: Custom Usage Score, Cycle Time (correlated with usage).
The Scorecard: Q4 2025 Status
As of Q4 2025, here's where we stand:
| Metric | Current State |
|---|---|
| Weekly Active Users using Coding Agents | 92% |
| Super Power Users | 9% (up from 2%) |
| AI Speed Impact Score | 2.29/5 (up from 2.23) |
| Code quality infrastructure | Quality Gates, Custom Lint Rules deployed |
| Training modules | 3 modules drafted, AI Learning Hub created |
The bottom line: AI coding tools can deliver measurable productivity improvements, but realizing those gains requires systematic measurement, quality guardrails, and sustained organizational focus.
Our actual results: 15% productivity gains for senior engineers and 3-4x PR velocity for Frontend Super Power Users are valuable, even if they don't match the initial 10x hype.
💡 We no longer optimize for ‘more AI’. We optimize for better AI.
The question isn't whether AI tools work - they do. The question is whether your organization is prepared to do the hard work of measurement, iteration, and infrastructure-building required to make them work effectively.
Acknowledgments
This initiative and analysis would not have been possible without the dedicated work of the entire Apollo Engineering team.
Major Contributions:
Special thanks to Ryan Alexander for spearheading the adoption of multiple AI tools beyond just Cursor.
AI Tooling Program Contributors:
Debanjan Choudhury, Apurv Garg, Adam Kusmierz, Shraey Chikker, Brandon Renfrow, Rahul Gautam, Ahmed Hamdy, Griffin Brodman, Deeksha Bilochi, Joshua Sullivan, Raja SK, Matt Welk, Tejas H N, Pete Kincaid, Przemyslaw Suchodolski, Hardik Badola, Nilarjun Das, Saurav Keshri, Hardik Bansal, Venkat Ram, Ralph Silaya, Akhil Chennareddy, Alisha Gupta, Arunkumar Nachimuthu, Edgar Harris, Hana Ito, Harshit Pandey, Kevin Yang, Marcin Mazurek, Mohamed Djadoun, Mohit Kumath, Neda Davis, Piotr Dyba, Prashant Yadav, Priya Surana, Rachel Vilceus, Rahul Singh, Siddharth Goswami, Siddharth Malik, Uwais Zaki, Vidya Nethi, Zachary Rogerson, Aditya Keri
We're continuing to iterate on our approach and measure results. If you're working on similar initiatives, we're happy to share more details about our measurement frameworks and learnings.