
How to Calculate Return on Sales: The 2026 Data-First Framework
Return on Sales (ROS) measures how much operating profit your business generates per dollar of revenue. In 2026, calculating ROS accurately requires more than a simple formula. With digital channels projected to account for 56% of B2B revenue and AI reshaping buying behavior, teams need a data-stack-first approach that connects costs to closed-won revenue across omnichannel journeys.
This guide delivers a practical ROS framework built for modern B2B teams.
You'll learn the calculation methods, build dashboards that meet real-time ROI demands, and implement templates that work across self-serve and sales-assisted motions.
Apollo Eliminates 4+ Hours Of Daily Research
Tired of spending 4+ hours daily hunting for contact info? Apollo delivers 224M verified contacts with 96% email accuracy instantly. Join 550K+ companies who replaced manual research with automated prospecting.
Start Free with Apollo →Key Takeaways
- ROS formula: Operating Income ÷ Net Sales × 100 (measures profit efficiency per revenue dollar)
- Data integration is critical: 84% of B2B marketers cite cross-platform correlation as a key measurement challenge
- Omnichannel attribution matters: separate ROS calculations for digital-led vs rep-led motions reveal true economics
- AI-influenced buying requires proxy metrics: track zero-click conversions and AI-assisted research touchpoints
- Real-time dashboards are now expected: segment ROS by channel, product, and customer journey stage
What Is Return on Sales and Why It Matters in 2026
Return on Sales (ROS) is an operating margin metric. It tells you what percentage of each sales dollar becomes operating profit after accounting for all operating expenses (COGS, SG&A, R&D).
Unlike gross margin, ROS includes your full cost structure.
The formula is straightforward:
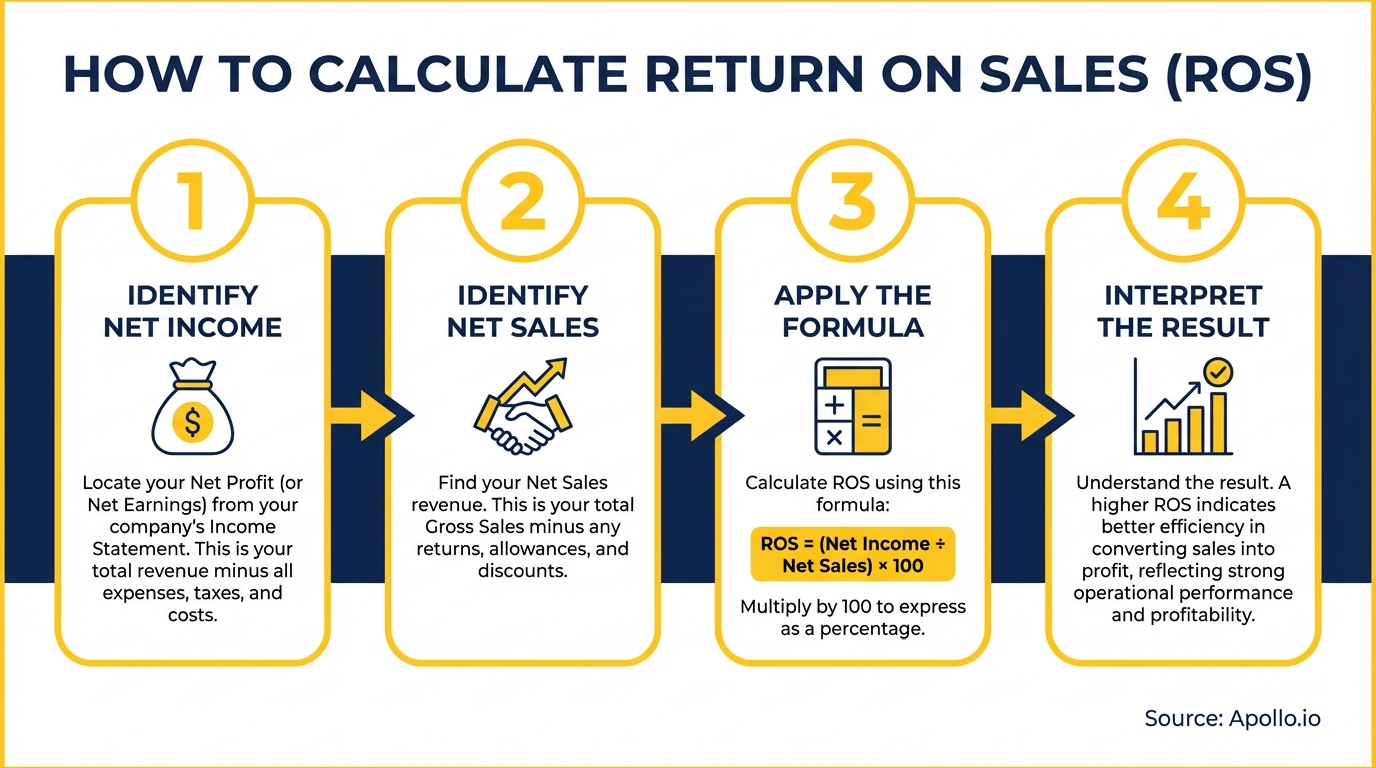
ROS = (Operating Income ÷ Net Sales) × 100
Where:
- Operating Income = Revenue minus COGS, SG&A, and other operating expenses (EBIT)
- Net Sales = Gross revenue minus returns, allowances, and discounts
ROS matters because it connects revenue growth to profitability. A company can grow revenue while destroying margin through discounting, inefficient operations, or high customer acquisition costs.
ROS exposes that dynamic.
"Apollo could be a third of the cost if you look at the full price of what we were spending on ZoomInfo, Outreach, Salesforce, and admins to make it all work."
How to Calculate Return on Sales: Step-by-Step
Follow this process to calculate ROS accurately:
Step 1: Define Your Net Sales Denominator
Start with gross revenue. Subtract returns, allowances, promotional discounts, and volume rebates. This gives you net sales. Enterprise deals with custom pricing require special attention here.
Step 2: Calculate Operating Income
Take net sales and subtract:
- Cost of Goods Sold (COGS)
- Sales, General & Administrative expenses (SG&A)
- Research & Development (R&D)
- Marketing and sales operations costs
The result is your operating income (EBIT). Do NOT use gross profit or EBITDA for ROS calculations.
Step 3: Apply the Formula
Divide operating income by net sales, then multiply by 100 for the percentage.
Example: A SaaS company with $10M net sales and $1.5M operating income has a 15% ROS.
Step 4: Segment by Channel and Journey
Modern B2B requires segmented ROS views. Calculate separately for:
- Digital self-serve revenue
- Sales-assisted revenue
- Product lines or business units
- Customer segments (SMB, mid-market, enterprise)
Need better pipeline visibility to track revenue by segment? Apollo's deal management tracks every opportunity with full context.
The Data Stack You Need for Accurate ROS
Calculating ROS in 2026 requires integrating data from multiple systems. Here's the minimum viable measurement stack:
| System | Data Required | Common Integration Challenge |
|---|---|---|
| CRM (Salesforce, HubSpot) | Pipeline value, deal stage, close dates, rep attribution | Incomplete opportunity data, missing touchpoints |
| Finance System (NetSuite, QuickBooks) | Revenue recognition, COGS, operating expenses, returns | Timing mismatches with CRM close dates |
| Marketing Automation (Marketo, Pardot) | Campaign costs, lead source, multi-touch attribution | Inconsistent UTM tracking, orphaned campaigns |
| Product Analytics (Mixpanel, Amplitude) | Self-serve conversion, product usage, expansion revenue | Anonymous user sessions, attribution gaps |
| Sales Engagement (Apollo, Outreach) | Outbound activity costs, sequence performance, rep productivity | Activity data disconnected from revenue outcomes |
The biggest blocker to accurate ROS? Data integration.
Teams struggle to correlate costs across platforms with closed-won revenue. Strong data governance and standard definitions across RevOps and Finance are non-negotiable.
Turn Forecast Guesswork Into Revenue Certainty
Pipeline forecasting a guessing game? Apollo delivers real-time deal intelligence and buying signals so you know exactly which opportunities will close. Built-In boosted win rates 10% with Apollo's scoring.
Start Free with Apollo →Industry Benchmarks: What's a Good ROS?
ROS benchmarks vary significantly by industry and business model:
| Industry | Typical ROS Range | Key Drivers |
|---|---|---|
| B2B SaaS (growth stage) | 5-15% | High CAC, R&D investment, land-and-expand |
| B2B SaaS (mature) | 15-30% | Improved retention, lower CAC, operational leverage |
| Manufacturing | 8-12% | Material costs, production efficiency, pricing power |
| Professional Services | 10-20% | Utilization rates, billing rates, delivery costs |
| E-commerce B2B | 3-8% | Fulfillment costs, platform fees, discounting |
Context matters more than absolute percentages. A growth-stage SaaS company prioritizing market share may accept lower ROS temporarily.
Track ROS trends over time and compare against your strategic goals.

Omnichannel ROS: Separating Digital and Sales-Assisted Revenue
According to recent research, 80% of B2B sales interactions now occur through digital channels. This shift demands separate ROS calculations for different go-to-market motions.
Digital Self-Serve ROS
Calculate ROS for product-led growth or e-commerce channels separately. Key cost components:
- Platform and hosting infrastructure
- Digital marketing spend (paid search, social, content)
- Product team allocation (onboarding, in-product education)
- Customer success automation tools
Sales-Assisted ROS
For deals involving sales reps, account for:
- Sales compensation (base, commission, benefits)
- Sales tools and technology stack
- Sales enablement and training
- Custom implementation and professional services
Most B2B companies now run hybrid motions. A prospect might start with self-serve research, engage with sales for enterprise features, then expand through product-led growth.
Your attribution model must handle these blended journeys without double-counting costs.
AI-Native ROS: Measuring AI-Influenced Revenue
AI is reshaping how buyers research and make decisions. Your ROS framework needs proxy metrics for AI-influenced buying behavior:
- Zero-click conversions: Buyers who convert without traditional touchpoint tracking
- AI research sessions: Interactions with AI assistants referencing your content
- Conversation intelligence: AI-summarized call insights driving deal velocity
- AI-generated personalization: Automated outreach at scale
When calculating ROS in an AI-driven environment, add AI tool costs to your operating expenses. This includes generative AI subscriptions, conversation intelligence platforms, and AI sales assistants.
Track which AI investments correlate with improved ROS to optimize your AI spend.
Struggling to scale personalized outreach without ballooning costs? Apollo's AI automation personalizes at scale while tracking true engagement.
Common ROS Calculation Mistakes to Avoid
Teams make predictable errors when calculating ROS. Here are the most common:
Using Gross Profit Instead of Operating Income
Gross profit only subtracts COGS. ROS requires operating income (EBIT), which includes all operating expenses.
Using gross profit inflates your ROS and hides inefficiencies in sales, marketing, and overhead.
Ignoring Returns, Discounts, and Allowances
Net sales must reflect actual cash collected. Failing to subtract returns, volume rebates, and promotional discounts overstates your denominator and understates ROS pressure from discounting.
Inconsistent Period Boundaries
Revenue recognition timing often differs from expense recognition. Align your measurement periods carefully.
If you're calculating quarterly ROS, ensure both revenue and expenses cover the exact same quarter.
Mixing EBITDA with EBIT
EBITDA adds back depreciation and amortization. ROS uses EBIT (operating income). Mixing these metrics produces incomparable results across periods.
Failing to Adjust for Non-Recurring Items
One-time gains (asset sales) or one-time costs (restructuring charges) distort ROS trends. Normalize for these items and document adjustments clearly for stakeholders.
Building Real-Time ROS Dashboards
Static quarterly ROS reporting no longer meets stakeholder expectations. Modern teams need real-time visibility into profitability drivers. Your ROS dashboard should include:
- Current period ROS vs prior period and target
- ROS by segment: product line, customer type, sales channel
- Trend analysis: 12-month rolling ROS to spot inflection points
- Driver decomposition: contribution from pricing, volume, cost efficiency
- Scenario modeling: impact of pricing changes, cost reductions, mix shifts
Connect your dashboard to source systems via API. Manual spreadsheet updates introduce errors and lag.
Modern BI tools (Tableau, Looker, Power BI) can refresh ROS metrics daily when properly configured.
"We reduced the complexity of three tools into one. We're getting higher reply rates, open rates are doubled, meetings are up, and speed to booking a meeting is cut in half."
Improving Your Return on Sales
Once you've established accurate ROS measurement, focus on improvement. Two primary levers exist: revenue enhancement and cost optimization.
Revenue Enhancement Strategies
- Pricing discipline: Reduce discretionary discounting through approval workflows
- Mix shift: Grow higher-margin product lines or customer segments
- Upsell and cross-sell: Expand existing accounts (lower CAC than new logos)
- Packaging optimization: Bundle features to increase average deal size
Cost Optimization Without Damaging Growth
- Sales tool consolidation: Replace multiple point solutions with integrated platforms
- Process automation: Reduce manual tasks in quote-to-cash workflows
- Channel optimization: Shift appropriate segments to lower-cost channels
- Vendor rationalization: Consolidate overlapping subscriptions and renegotiate contracts
According to recent data, 58% of B2B marketers believe content marketing helped increase sales and revenue in 2024. Optimizing your content-to-revenue engine improves ROS by lowering customer acquisition costs while maintaining deal velocity. See how sales analytics can uncover hidden efficiency opportunities.
Frequently Asked Questions
What's the difference between ROS and profit margin?
ROS specifically uses operating income (EBIT) and net sales. "Profit margin" can refer to gross margin, operating margin, or net margin. ROS is equivalent to operating margin.
Always clarify which margin metric you're discussing.
How often should you calculate ROS?
Calculate ROS monthly for internal management and quarterly for board reporting. More frequent calculation (weekly or daily) is possible with real-time dashboards but adds complexity.
Match frequency to decision-making needs.
Can ROS be negative?
Yes. Negative ROS means operating expenses exceed gross profit.
This is common in high-growth companies prioritizing market share over profitability. Track the path to positive ROS and ensure runway supports your timeline.
What's a good ROS percentage?
Industry and business model determine "good" ROS. B2B SaaS companies at scale often target 20-30%.
Early-stage companies may accept 5-10% or negative ROS while investing in growth. Compare against your strategic plan and industry benchmarks, not absolute thresholds.

Conclusion
Return on Sales reveals whether your revenue growth translates into sustainable profitability. The 2026 ROS framework requires integrating data across CRM, finance, and marketing systems; separating digital and sales-assisted economics; accounting for AI-influenced buying behavior; and delivering real-time visibility to stakeholders.
Start with accurate measurement. Build the minimum viable data stack.
Segment ROS by channel and journey. Implement dashboards that surface profitability drivers.
Then optimize relentlessly through pricing discipline, mix management, and cost efficiency.
The teams that master ROS measurement and improvement will capture margin while competitors chase vanity metrics. Your CFO and board will notice.
Ready to improve your sales efficiency? Try Apollo Free and consolidate your sales tech stack while tracking every revenue-driving activity.
Prove Apollo's ROI In Your First 30 Days
Budget approval stuck on unclear metrics? Apollo delivers measurable pipeline impact from day one—track time saved, meetings booked, and deals closed. Built-In increased win rates 10% and ACV 10% with Apollo's scoring.
Start Free with Apollo →Don't miss these
Data
How to Structure a Marketing Team That Actually Drives Revenue in 2026
Data
Solving Data Synchronization Headaches Across Multiple Business Systems
Data
What Marketing Metrics Should B2B Teams Track in 2026?
See Apollo in action
We'd love to show how Apollo can help you sell better.
By submitting this form, you will receive information, tips, and promotions from Apollo. To learn more, see our Privacy Statement.
4.7/5 based on 9,015 reviews
