🔭 Analytics' Vision
Before we get started, did we tell you that we are hiring? Apollo.io is an all-remote company and we have team members who currently work from 30+ countries! Check out our open roles here.
Apollo seeks to empower GTM teams with an end-to-end platform for all their sales needs, from finding the right customers to winning deals.
Within every step in their journey at Apollo, analytics enables customers to deep dive into their metrics and performance. Like a trusted “sherpa”, it has been guiding teams to make data-informed decisions that identify opportunities to 10x their team’s sales performance.
💪 Capabilities
In simple terms, Analytics provide you with actionable data you can use to transform your company's sales efforts. This data can be viewed via several reports that you can custom create or leverage one of the many templates already available.
- One of the most common & simplest examples is teams being able to track the performance of their email campaigns by tracking the “number of emails sent” “%-age of email open rate” “reply rate” etc
- Another use case could be using the dialer feature to track “number of calls made by the sales rep of a team in a week” or analyze the “%-age of calls connected by industry” and so on.
The Analytics system, in its entirety, has two major components:
- Analytics Engine consisting of the application and data layer powering the APIs
- Reusable Data Visualization components (like graphs, charts and tables) for surfacing analytics data
🧱 Building Blocks
These are the building blocks of the analytics platform at Apollo:
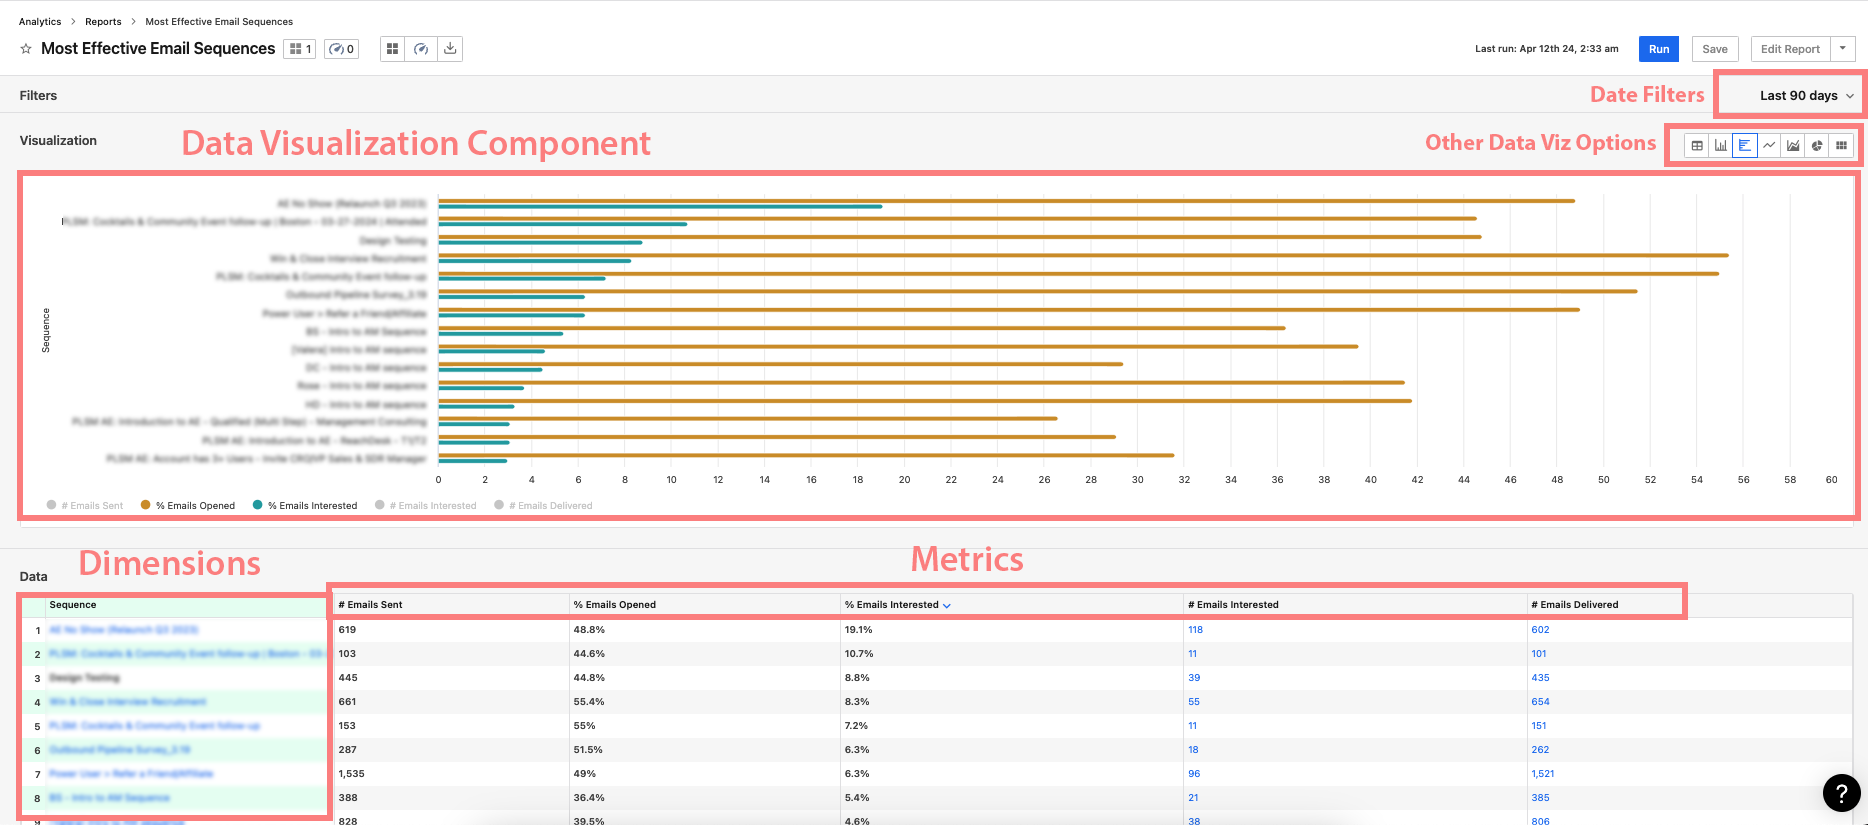
- Metrics - data points related to Apollo activities, that sales teams track.
- Customers who leverage Apollo’s email activities, track metrics such as “Number of Emails Sent” or “%age of Email Open Rates” - both of which are ‘metrics’
-
Dimensions - which are qualitative properties, upon which the data is grouped by, such as users and timeframes. It comes in two flavours:
- row-level and
- column-level “group-by”s
- customers who group “Emails sent” data by “user” and by “day of the week”, the user is the primary grouping, while the day of the week is the secondary grouping, which is applied at each user level.
-
Filters - as the name suggests, help in providing granularity to data and viewing metrics that match specific criteria
- Email subject includes “success” OR Company Industry includes “health”
-
Reports - consist of selected metrics and dimensions within a specific time range. Customers can visualize the data via tables, bar graphs, line graphs, area graphs, pie charts, heatmaps and more
-
Dashboards - compilations of reports, created by the teams for grouping reports. Both reports and dashboards are offered as pre-built templates and a customizable feature.
Here is the visualization of how the magic unfolds -
🚀 Scale
As of today, we have over 2.7M reports & 300K+ dashboards created on the Apollo Platform. The servers clock ~ 100K requests per day on our report execution APIs with the most used APIs hitting a throughput of 100 requests per minute at peak hours.
🗺️ Journey of an Analytics API request
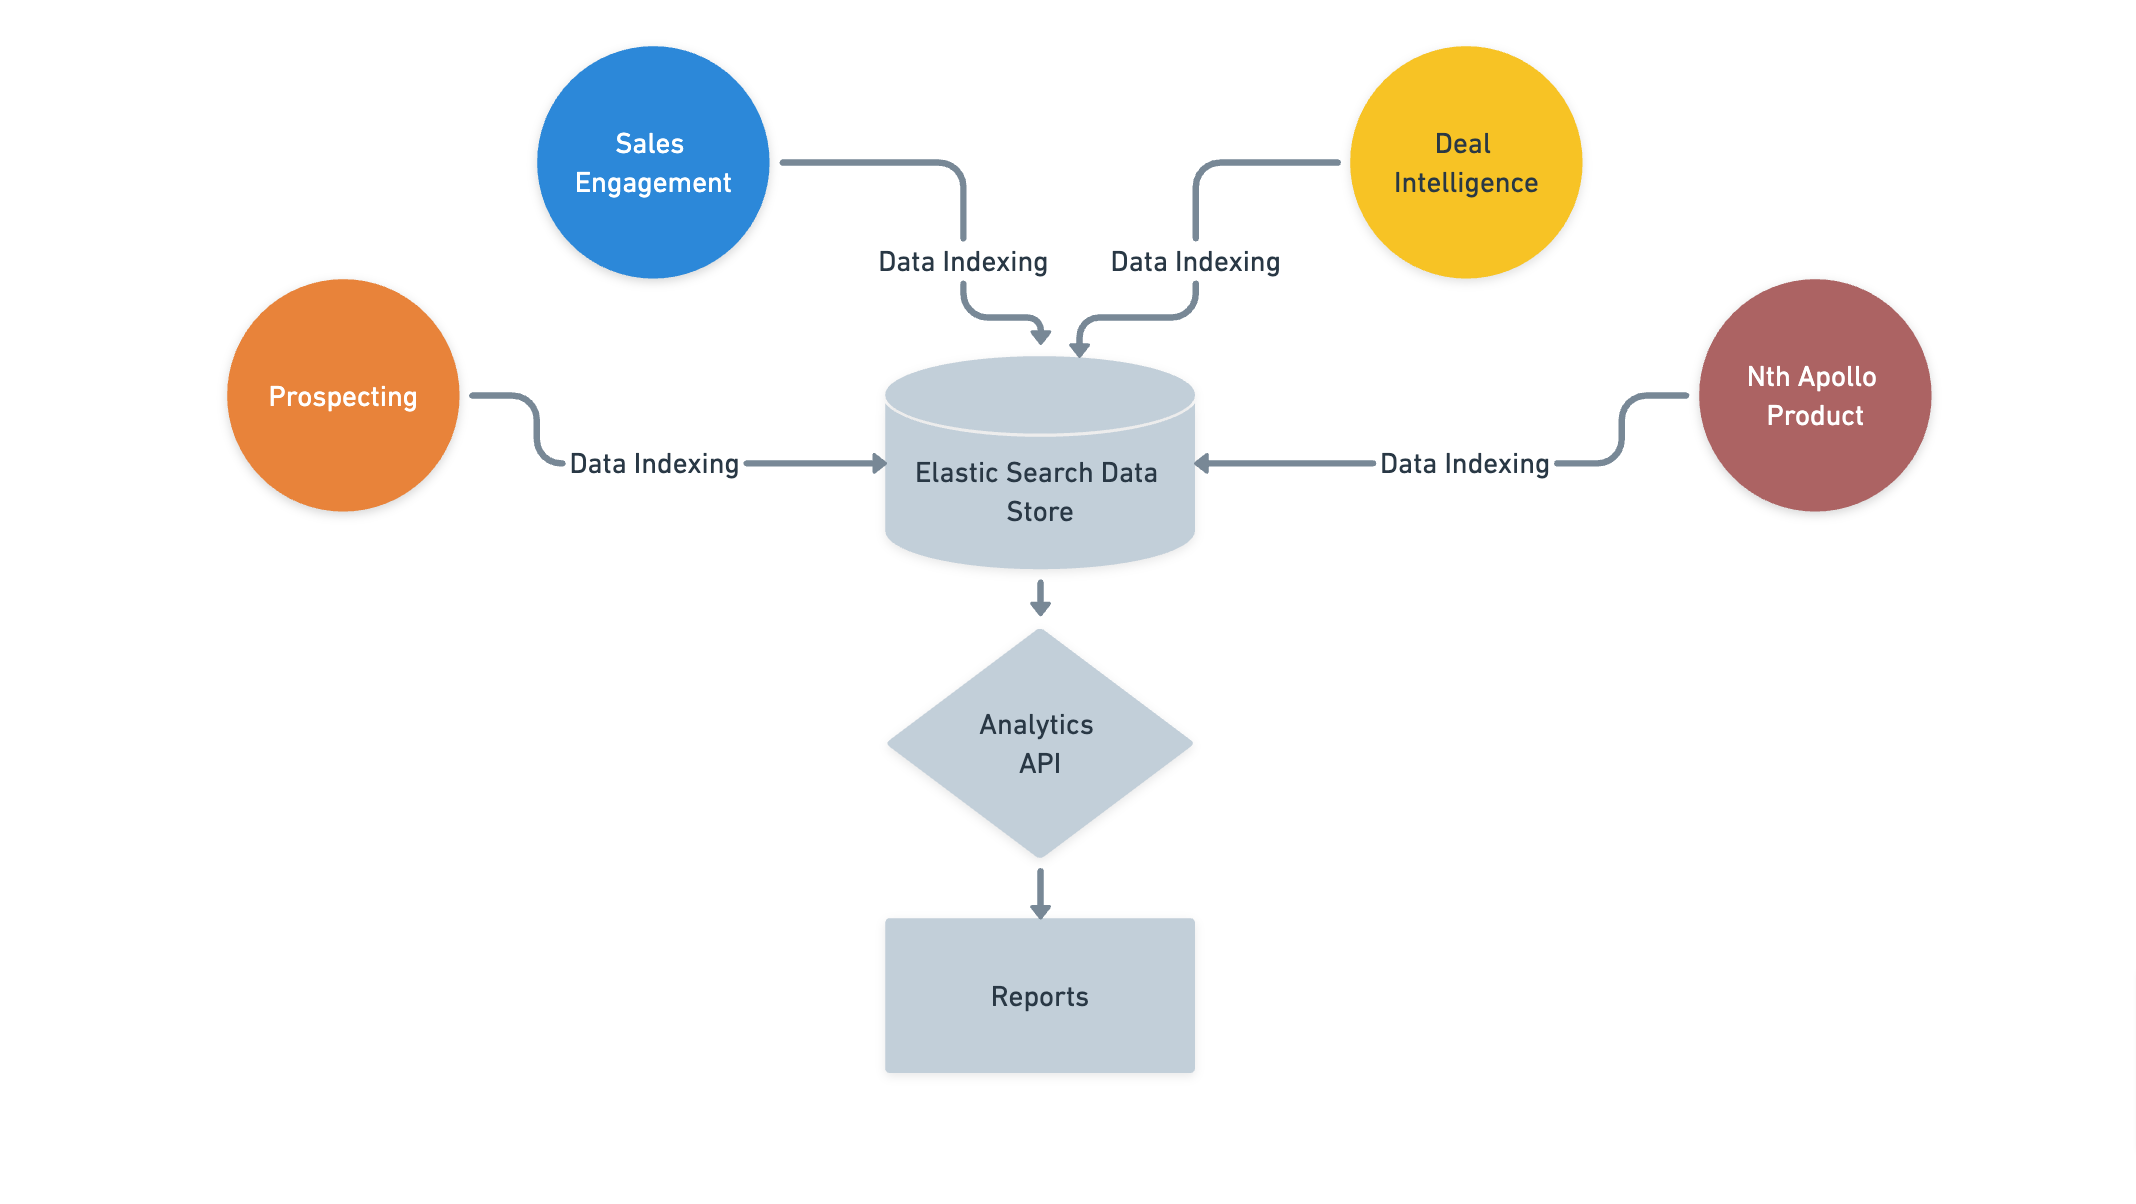
High-level Data Flow:
We are using Elasticsearch to power our Analytics engine. All of Apollo’s product lines - from prospecting to sales engagement and more store their data in ES in some shape & form. Elastisearch serves two main purposes:
- Fast search of data (used for data filtering in the respective product line)
- Powering Analytics
Why Elasticsearch?
Mainly for the following reasons:
- Efficient string search enables filtering data based on specified criteria needed to create reports quickly
- Built-in aggregation capabilities
- Support for an exponential number of filters without the need to build a proportionate number of composite indexes
- Horizontal scaling via sharding to facilitate fast data access
- Efficient, in-place same document updates, which is necessary to keep analytics data up-to-date
Analytics API Request
-
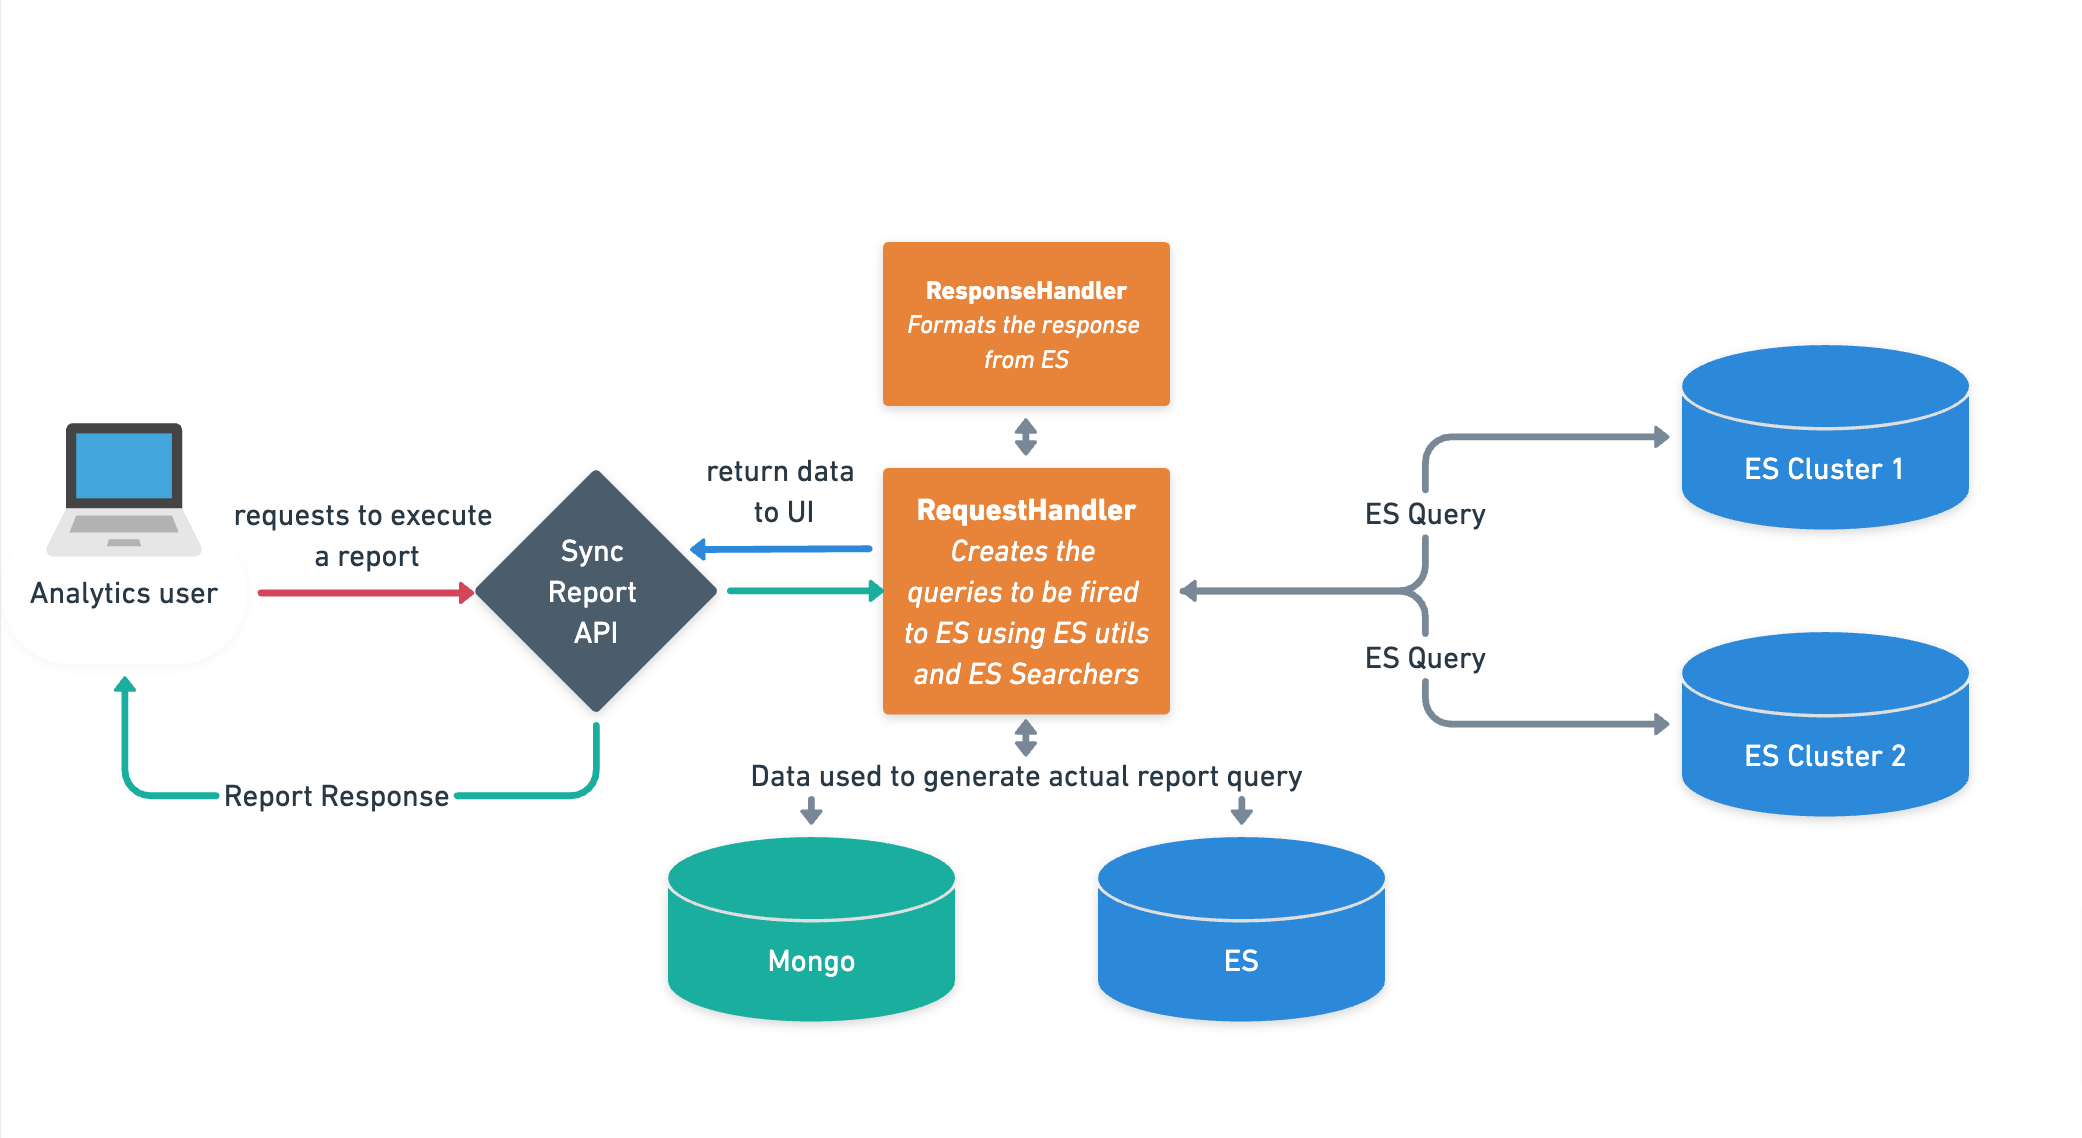
Requests for reports sent from the UI are used to construct Elasticsearch queries.
For example, a report for “the number of emails sent by a particular user in the last 30 days” equates to the Elasticsearch query to filter “the number of emails, filtered by a particular user ID that lies between a specific date range.”
-
The
RequestHandlerservice breaks down the data points needed in a report and intelligently constructs the most efficient query to Elasticsearch. Additionally, “group-bys” in reports are nothing but complex ES aggregations. -
Apollo Analytics has a generic
Searcherservice associated with each Elasticsearch Index that has all the possible queries for filtering the data. In the spirit of reusability,RequestHandlerreuses these searchers to create the queries. -
Data received from Elasticsearch is formatted by a service called
ResponseHandlerto ensure that the API response for all permutations of metrics and dimensions is consistent in shape for our data visualization components to render.
💡 4 Key points for building “Analytics” the right way
Reusability
The application layer of the analytics engine was decoupled from the underlying data store. We reuse Elasticsearch, which is also used for search under the Prospecting product line. The analytics engine injects filters intelligently into the search queries and grabs the data required for reports. In the future, we can extend it to use a new data store, such as Snowflake and MongoDB, which provides flexibility to adapt per the evolving product needs.
Knowing the business needs
When building analytics, we identified what data points and metrics are useful to the user. For each core data model, we selected metrics needed for reports. We also conducted due diligence on dimensions or “group-by”s that would be valuable for users to apply on top of their metrics. Since Elasticsearch does not natively support cross-index joins, to derive meaningful relationships between data from different indexes, we denormalized data points to ensure Elasticsearch can run aggregations to create beneficial reports.
Extensibility
Since analytics is a shared service for multiple products across Apollo, we wanted to make it frictionless for other Apollo product teams to integrate their data into analytics. This ensured that the platform improvements made by our core Analytics engineering team could benefit interested product teams. Through guidance and documentation, we empower our users with data-powered insights.
Templatization
Creating reports and dashboards can be difficult for new users of Apollo. To support every new team, we created "default reports and dashboards" that users can use from Day 1. It is through these curated sets of reports and dashboards that we highlight the most valuable metrics for our GTM teams.
🎯 What's next?
Hint: Goal Tracking..
Now that we have an understanding of what Analytics at Apollo is capable of and how it has been built, it’s time to get ready for our newest feature - “Goal Tracking” which enables customers to set “targets” or “goals” on top of analytics metrics, track progress, and take corrective actions should a goal get off-track.
Stay tuned to learn more about Apollo’s “Goal Tracking” feature!
🔮 We are hiring…
The analytics we offer our customers has been instrumental in helping customers become more data-driven decision-makers and avoid biases. And many more such complex problems are being solved by our engineers for our customers.
Are you ready to be part of this journey? Join us at Apollo.io, and let’s build something extraordinary together. Click here to apply now!


